Post-16 Transitions: a Longitudinal Study of Young People with ...
Post-16 Transitions: a Longitudinal Study of Young People with ...
Post-16 Transitions: a Longitudinal Study of Young People with ...

You also want an ePaper? Increase the reach of your titles
YUMPU automatically turns print PDFs into web optimized ePapers that Google loves.
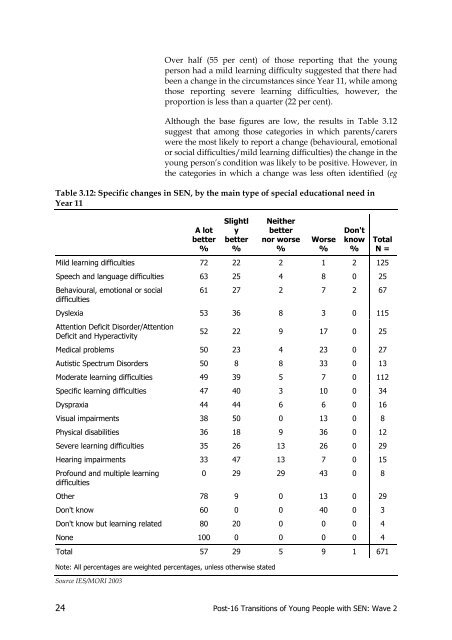
Over half (55 per cent) <strong>of</strong> those reporting that the young<br />
person had a mild learning difficulty suggested that there had<br />
been a change in the circumstances since Year 11, while among<br />
those reporting severe learning difficulties, however, the<br />
proportion is less than a quarter (22 per cent).<br />
Although the base figures are low, the results in Table 3.12<br />
suggest that among those categories in which parents/carers<br />
were the most likely to report a change (behavioural, emotional<br />
or social difficulties/mild learning difficulties) the change in the<br />
young person’s condition was likely to be positive. However, in<br />
the categories in which a change was less <strong>of</strong>ten identified (eg<br />
Table 3.12: Specific changes in SEN, by the main type <strong>of</strong> special educational need in<br />
Year 11<br />
A lot<br />
better<br />
%<br />
Slightl<br />
y<br />
better<br />
%<br />
Neither<br />
better<br />
nor worse<br />
%<br />
Worse<br />
%<br />
Don't<br />
know<br />
%<br />
Mild learning difficulties 72 22 2 1 2 125<br />
Speech and language difficulties 63 25 4 8 0 25<br />
Behavioural, emotional or social<br />
difficulties<br />
Total<br />
N =<br />
61 27 2 7 2 67<br />
Dyslexia 53 36 8 3 0 115<br />
Attention Deficit Disorder/Attention<br />
Deficit and Hyperactivity<br />
52 22 9 17 0 25<br />
Medical problems 50 23 4 23 0 27<br />
Autistic Spectrum Disorders 50 8 8 33 0 13<br />
Moderate learning difficulties 49 39 5 7 0 112<br />
Specific learning difficulties 47 40 3 10 0 34<br />
Dyspraxia 44 44 6 6 0 <strong>16</strong><br />
Visual impairments 38 50 0 13 0 8<br />
Physical disabilities 36 18 9 36 0 12<br />
Severe learning difficulties 35 26 13 26 0 29<br />
Hearing impairments 33 47 13 7 0 15<br />
Pr<strong>of</strong>ound and multiple learning<br />
difficulties<br />
0 29 29 43 0 8<br />
Other 78 9 0 13 0 29<br />
Don't know 60 0 0 40 0 3<br />
Don't know but learning related 80 20 0 0 0 4<br />
None 100 0 0 0 0 4<br />
Total 57 29 5 9 1 671<br />
Note: All percentages are weighted percentages, unless otherwise stated<br />
Source IES/MORI 2003<br />
24 <strong>Post</strong>-<strong>16</strong> <strong>Transitions</strong> <strong>of</strong> <strong>Young</strong> <strong>People</strong> <strong>with</strong> SEN: Wave 2