annual report - Royal Haskoning
annual report - Royal Haskoning
annual report - Royal Haskoning

You also want an ePaper? Increase the reach of your titles
YUMPU automatically turns print PDFs into web optimized ePapers that Google loves.
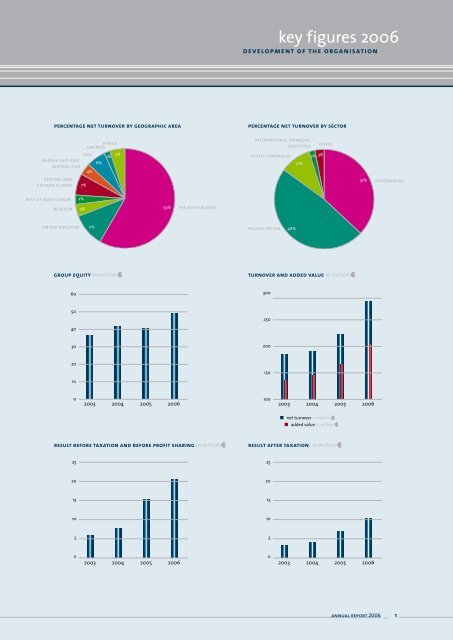
key figures 2006<br />
development of the organisation<br />
percentage net turnover by geographic area<br />
percentage net turnover by sector<br />
america africa<br />
international financial<br />
institutes<br />
other<br />
middle east and<br />
central asia<br />
asia<br />
4%<br />
6%<br />
1%<br />
5%<br />
utility companies<br />
10%<br />
2% 3%<br />
central and<br />
eastern europe<br />
7%<br />
37%<br />
government<br />
rest of west europe<br />
2%<br />
belgium<br />
4%<br />
59%<br />
the netherlands<br />
united kingdom<br />
11%<br />
private sector<br />
48%<br />
group equity in million 1<br />
turnover and added value in million 1<br />
60<br />
300<br />
50<br />
250<br />
40<br />
30<br />
200<br />
20<br />
150<br />
10<br />
0<br />
2003 2004 2005 2006<br />
100<br />
2003 2004 2005 2006<br />
net turnover in million 1<br />
added value in million 1<br />
result before taxation and before profit sharing in million 1<br />
result after taxation in million 1<br />
25<br />
25<br />
20<br />
20<br />
15<br />
15<br />
10<br />
10<br />
5<br />
5<br />
0<br />
2003 2004 2005 2006<br />
0<br />
2003 2004 2005 2006<br />
<strong>annual</strong> <strong>report</strong> 2006 >><br />
1