Gender in niGeria report 2012 - Economic Commission for Africa
Gender in niGeria report 2012 - Economic Commission for Africa
Gender in niGeria report 2012 - Economic Commission for Africa

You also want an ePaper? Increase the reach of your titles
YUMPU automatically turns print PDFs into web optimized ePapers that Google loves.
<strong>Gender</strong> <strong>in</strong> Nigeria Report <strong>2012</strong>: Improv<strong>in</strong>g the Lives of Girls and Women <strong>in</strong> Nigeria 13<br />
poor. 11 Inequality has historical orig<strong>in</strong>s, but the <strong>in</strong>vestment decisions by successive<br />
governments have exacerbated <strong>in</strong>come disparities among social groups as well as<br />
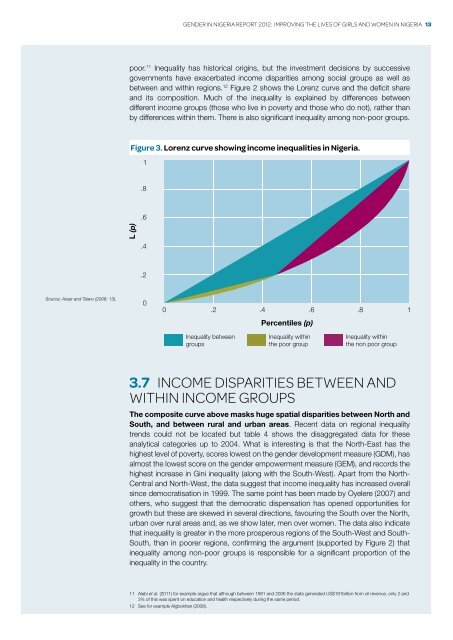
between and with<strong>in</strong> regions. 12 Figure 2 shows the Lorenz curve and the deficit share<br />
and its composition. Much of the <strong>in</strong>equality is expla<strong>in</strong>ed by differences between<br />
different <strong>in</strong>come groups (those who live <strong>in</strong> poverty and those who do not), rather than<br />
by differences with<strong>in</strong> them. There is also significant <strong>in</strong>equality among non-poor groups.<br />
Figure 3. Lorenz curve show<strong>in</strong>g <strong>in</strong>come <strong>in</strong>equalities <strong>in</strong> Nigeria.<br />
1<br />
.8<br />
.6<br />
L (p)<br />
.4<br />
.2<br />
Source: Araar and Taiwo (2006: 13).<br />
0<br />
0 .2 .4 .6 .8 1<br />
Percentiles (p)<br />
Inequality between<br />
groups<br />
Inequality with<strong>in</strong><br />
the poor group<br />
Inequality with<strong>in</strong><br />
the non poor group<br />
3.7 Income disparities between and<br />
with<strong>in</strong> <strong>in</strong>come groups<br />
The composite curve above masks huge spatial disparities between North and<br />
South, and between rural and urban areas. Recent data on regional <strong>in</strong>equality<br />
trends could not be located but table 4 shows the disaggregated data <strong>for</strong> these<br />
analytical categories up to 2004. What is <strong>in</strong>terest<strong>in</strong>g is that the North-East has the<br />
highest level of poverty, scores lowest on the gender development measure (GDM), has<br />
almost the lowest score on the gender empowerment measure (GEM), and records the<br />
highest <strong>in</strong>crease <strong>in</strong> G<strong>in</strong>i <strong>in</strong>equality (along with the South-West). Apart from the North-<br />
Central and North-West, the data suggest that <strong>in</strong>come <strong>in</strong>equality has <strong>in</strong>creased overall<br />
s<strong>in</strong>ce democratisation <strong>in</strong> 1999. The same po<strong>in</strong>t has been made by Oyelere (2007) and<br />
others, who suggest that the democratic dispensation has opened opportunities <strong>for</strong><br />
growth but these are skewed <strong>in</strong> several directions, favour<strong>in</strong>g the South over the North,<br />
urban over rural areas and, as we show later, men over women. The data also <strong>in</strong>dicate<br />
that <strong>in</strong>equality is greater <strong>in</strong> the more prosperous regions of the South-West and South-<br />
South, than <strong>in</strong> poorer regions, confirm<strong>in</strong>g the argument (supported by Figure 2) that<br />
<strong>in</strong>equality among non-poor groups is responsible <strong>for</strong> a significant proportion of the<br />
<strong>in</strong>equality <strong>in</strong> the country.<br />
11 Alabi et al. (2011) <strong>for</strong> example argue that although between 1981 and 2006 the state generated US$191billion from oil revenue, only 2 and<br />
3% of this was spent on education and health respectively dur<strong>in</strong>g the same period.<br />
12 See <strong>for</strong> example Aigbokhan (2008).