Gender in niGeria report 2012 - Economic Commission for Africa
Gender in niGeria report 2012 - Economic Commission for Africa
Gender in niGeria report 2012 - Economic Commission for Africa

You also want an ePaper? Increase the reach of your titles
YUMPU automatically turns print PDFs into web optimized ePapers that Google loves.
<strong>Gender</strong> <strong>in</strong> Nigeria Report <strong>2012</strong>: Improv<strong>in</strong>g the Lives of Girls and Women <strong>in</strong> Nigeria 55<br />
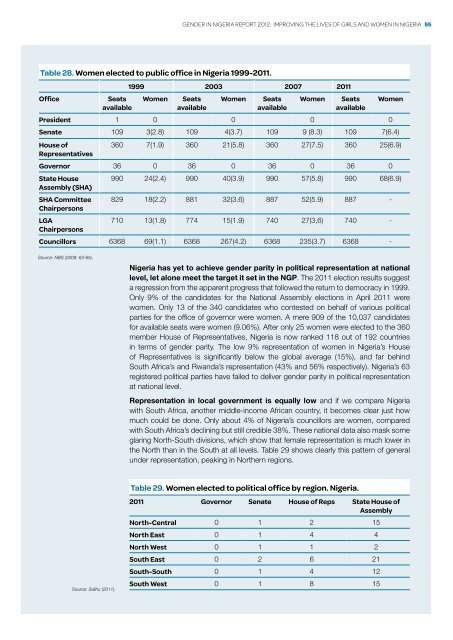
Table 28. Women elected to public office <strong>in</strong> Nigeria 1999-2011.<br />
Office<br />
Seats<br />
available<br />
1999 2003 2007 2011<br />
Women Seats Women Seats Women<br />
available<br />
available<br />
Seats<br />
available<br />
Women<br />
President 1 0 0 0 0<br />
Senate 109 3(2.8) 109 4(3.7) 109 9 (8.3) 109 7(6.4)<br />
House of<br />
360 7(1.9) 360 21(5.8) 360 27(7.5) 360 25(6.9)<br />
Representatives<br />
Governor 36 0 36 0 36 0 36 0<br />
State House 990 24(2.4) 990 40(3.9) 990 57(5.8) 990 68(6.9)<br />
Assembly (SHA)<br />
SHA Committee 829 18(2.2) 881 32(3.6) 887 52(5.9) 887 -<br />
Chairpersons<br />
LGA<br />
710 13(1.8) 774 15(1.9) 740 27(3,6) 740 -<br />
Chairpersons<br />
Councillors 6368 69(1.1) 6368 267(4.2) 6368 235(3.7) 6368 -<br />
Source: NBS (2009: 63-65).<br />
Nigeria has yet to achieve gender parity <strong>in</strong> political representation at national<br />
level, let alone meet the target it set <strong>in</strong> the NGP. The 2011 election results suggest<br />
a regression from the apparent progress that followed the return to democracy <strong>in</strong> 1999.<br />
Only 9% of the candidates <strong>for</strong> the National Assembly elections <strong>in</strong> April 2011 were<br />
women. Only 13 of the 340 candidates who contested on behalf of various political<br />
parties <strong>for</strong> the office of governor were women. A mere 909 of the 10,037 candidates<br />
<strong>for</strong> available seats were women (9.06%). After only 25 women were elected to the 360<br />
member House of Representatives, Nigeria is now ranked 118 out of 192 countries<br />
<strong>in</strong> terms of gender parity. The low 9% representation of women <strong>in</strong> Nigeria’s House<br />
of Representatives is significantly below the global average (15%), and far beh<strong>in</strong>d<br />
South <strong>Africa</strong>’s and Rwanda’s representation (43% and 56% respectively). Nigeria’s 63<br />
registered political parties have failed to deliver gender parity <strong>in</strong> political representation<br />
at national level.<br />
Representation <strong>in</strong> local government is equally low and if we compare Nigeria<br />
with South <strong>Africa</strong>, another middle-<strong>in</strong>come <strong>Africa</strong>n country, it becomes clear just how<br />
much could be done. Only about 4% of Nigeria’s councillors are women, compared<br />
with South <strong>Africa</strong>’s decl<strong>in</strong><strong>in</strong>g but still credible 38%. These national data also mask some<br />
glar<strong>in</strong>g North-South divisions, which show that female representation is much lower <strong>in</strong><br />
the North than <strong>in</strong> the South at all levels. Table 29 shows clearly this pattern of general<br />
under representation, peak<strong>in</strong>g <strong>in</strong> Northern regions.<br />
Source: Salihu (2011).<br />
Table 29. Women elected to political office by region. Nigeria.<br />
2011 Governor Senate House of Reps State House of<br />
Assembly<br />
North-Central 0 1 2 15<br />
North East 0 1 4 4<br />
North West 0 1 1 2<br />
South East 0 2 6 21<br />
South-South 0 1 4 12<br />
South West 0 1 8 15