ANALYSIS OF FOOD CONSUMPTION DATA IN THE ... - NSCB
ANALYSIS OF FOOD CONSUMPTION DATA IN THE ... - NSCB
ANALYSIS OF FOOD CONSUMPTION DATA IN THE ... - NSCB

Create successful ePaper yourself
Turn your PDF publications into a flip-book with our unique Google optimized e-Paper software.
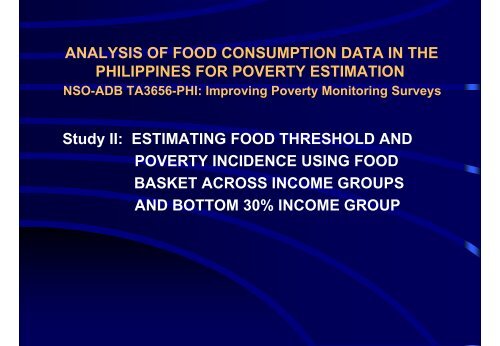
<strong>ANALYSIS</strong> <strong>OF</strong> <strong>FOOD</strong> <strong>CONSUMPTION</strong> <strong>DATA</strong> <strong>IN</strong> <strong>THE</strong><br />
PHILIPP<strong>IN</strong>ES FOR POVERTY ESTIMATION<br />
NSO-ADB TA3656-PHI: Improving Poverty Monitoring Surveys<br />
Study II: ESTIMAT<strong>IN</strong>G <strong>FOOD</strong> THRESHOLD AND<br />
POVERTY <strong>IN</strong>CIDENCE US<strong>IN</strong>G <strong>FOOD</strong><br />
BASKET ACROSS <strong>IN</strong>COME GROUPS<br />
AND BOTTOM 30% <strong>IN</strong>COME GROUP
Critiques to the Low-Cost, Nutritionally-Adequate<br />
Menus approach:<br />
! tendency towards overestimating food threshold because<br />
the list of commonly eaten foods were derived from<br />
all income groups rather than the poor<br />
! tendency to produce estimates of food poor based on<br />
different standards of living between regions<br />
and provinces
GENERAL OBJECTIVE:<br />
To compare the food basket (derived from the 1993<br />
National Nutrition Surveys), and food threshold of<br />
households across income groups and in the bottom 30%<br />
income group for estimating poverty incidence.
Specific Objectives:<br />
1. To derive the actual food basket of Filipino households<br />
across income groups and in the bottom 30% income<br />
group from the 1993 Food Consumption Survey of the<br />
NNS;<br />
2. To estimate urban and rural food thresholds derived<br />
from the food baskets of households across income<br />
groups and the bottom 30% income group; and<br />
3. To validate the derived food thresholds as tool for<br />
estimating urban and rural poverty incidence using<br />
consumption of households in the bottom 30% income<br />
group from the 2000 FIES as benchmark indicator.
METHOD<br />
1. Data cleaning, which included grouping of –<br />
(i) fishes to small to medium and medium-large to<br />
very large groups,<br />
(ii) all shellfishes,<br />
(iii) ordinary and special rice (except as rice<br />
products such as rice cakes, etc.),<br />
(iv) all kinds of milk,<br />
(v) breads and special bakery products
METHOD<br />
2. Shortlisting and ranking of food items based on the<br />
distribution of food items by energy and protein<br />
contribution in the “all income group” and “bottom 30%<br />
income group,” urban and rural domains;<br />
3. Stepwise non-parametric (kernel) discriminant analysis<br />
using the ranked data of food items from no. 2, to identify<br />
the food items that distinguished households with<br />
adequate (100%) intakes from those households with<br />
inadequate (
METHOD<br />
4. Stepwise logistic regression, with “having adequate (100%)<br />
energy and protein intakes” as dependent variable and the<br />
food items, in grams of intake, found significant from the<br />
discriminant analysis as the independent variables. The<br />
food items that came out significant at α < .05 in the model<br />
comprised the food basket;<br />
5. Adjusting the food basket to reach the nutrition standard.<br />
This included the addition of foods to meet at least 80%<br />
adequacy for vitamin A and iron, and adjusting the<br />
amount of some foods (eg. rice, cooking oil) to meet 100%<br />
energy;
METHOD<br />
6. Computing food cost based on the National Level 2000<br />
Price Estimates of various food commodities (NSO 2000),<br />
to estimate food threshold; and<br />
7. Estimating food poverty incidence from the 2000 FIES<br />
based on total family expenditure.
Daily per capita food basket derived from “all income group” vs. “bottom<br />
30% income group” : urban<br />
All income group<br />
1. Rice<br />
363.0g *<br />
2. Bread<br />
16.1<br />
3. Pork<br />
31.6<br />
4. Fish<br />
20.9<br />
5. Chicken<br />
12.6<br />
6. Dried fish<br />
10.0<br />
7. Noodles<br />
8.1<br />
8. Mungbeans & Products<br />
5.7<br />
Energy<br />
9. Condiments<br />
16.5 (kcal,%RDA) 1994 kcal,<br />
100% 10. Egg<br />
Protein 13.2 (g,%) 50g,<br />
100% 11. Sugars<br />
Vitamin 21.2A (mcg RE, %) 458 mcg,<br />
100% 12. Fruits<br />
Iron (mg,<br />
65.2<br />
%)<br />
12mg,<br />
* with adjustment in quantity or weight of food item ** additional item<br />
Bottom 30% income group<br />
1. Rice<br />
407.0g *<br />
2. Bread<br />
18.0<br />
3. Pork<br />
30.0<br />
4. Dried fish<br />
21.0<br />
5. Noodles<br />
7.7<br />
6. Condiments<br />
17.4<br />
7. Sugars<br />
6.2<br />
8. Fruits<br />
Energy 67.5 (kcal,%RDA) 1994 kcal,<br />
100% 9. Cooking oil/gata<br />
Protein<br />
15.5<br />
(g,%)<br />
*<br />
50g,<br />
10. Kangkong/malunggay/<br />
100% 30.0 **<br />
Vitamin kamote A (mcg tops/gabi,leaves<br />
RE,%) 458mcg,<br />
100%<br />
Iron (mg, %)<br />
12mg,
Daily per capita food basket derived from “all income group” vs. “bottom<br />
30% income group”: rural<br />
All income group<br />
1. Rice 375.0g *<br />
2. Bread 11.5<br />
3. Pork 30.5 *<br />
4. Chicken 8.0<br />
5. Dried fish 14.4<br />
6. Noodles 4.7<br />
7. Mungbeans & Prod. 5.5<br />
8. Condiments 15.6<br />
9. Sugars 18.9<br />
10. Fruits 64.0<br />
11. Cooking oil/gata 16.7 *<br />
12. Milk 15.0<br />
13. Kangkong/malung- 26.0 **<br />
gay/kamote & gabi,leaves<br />
Energy (kcal,%RDA) 1994 kcal,<br />
100%<br />
Protein (g,%) 50g,<br />
100%<br />
Vitamin A (mcg RE, %) 458mcg,<br />
100%<br />
Iron (mg, %)<br />
12mg,<br />
80%<br />
Bottom 30% income group<br />
1. Rice 407.0g *<br />
2. Bread 6.8<br />
3. Pork 9.5<br />
4. Fish 22.0 *<br />
5. Dried fish 15.3<br />
6. Mungbeans & Prod. 4.4<br />
7. Condiments 17.0 **<br />
8. Sugars 16.0<br />
9. Fruits 55.7<br />
10. Cooking oil/gata 21.5 *<br />
11. Milk 8.2<br />
12. Kangkong/malung- 24.0 **<br />
gay/kamote & gabi,leaves<br />
Energy (kcal,%RDA) 1994 kcal,<br />
100%<br />
Protein (g,%) 50g,<br />
100%<br />
Vitamin A (mcg RE, %) 458mcg,<br />
100%<br />
Iron (mg, %) 12mg ,<br />
80%<br />
* with adjustment in quantity or weight of food item ** additional food item
Daily per capita food basket derived from “all income group” vs. “bottom<br />
30% income group” : All(urban + rural)<br />
All income group<br />
1. Rice<br />
348.0 g *<br />
2. Bread<br />
14.0<br />
3. Pork<br />
25.4<br />
4. Fish<br />
20.0<br />
5. Chicken<br />
10.5<br />
6. Dried fish<br />
9.5 *<br />
7. Noodles<br />
6.6<br />
8. Mungbeans & Products<br />
Energy 5.6(kcal,%RDA)<br />
1994 kcal,<br />
100% 9. Condiments<br />
Protein<br />
16.1<br />
(g,%) 50g,<br />
10. Egg<br />
100% 10.9<br />
Vitamin 11. Sugars A (mcg RE, %) 458 mcg,<br />
100% 20.2<br />
Iron 12. Fruits (mg, %)<br />
12mg,<br />
* with adjustment in quantity or weight of food item ** additional item<br />
Bottom 30% income group<br />
1. Rice<br />
407.0g *<br />
2. Bread<br />
9.7<br />
3. Pork<br />
11.1<br />
4. Fish<br />
28.5<br />
5 Noodles<br />
3.9<br />
6. Dried fish<br />
13.7<br />
7. Mungbens & Products<br />
4.6<br />
8. Condiments<br />
Energy 13.0 (kcal,%RDA) **<br />
1994 kcal,<br />
9. 100% Sugars<br />
Protein<br />
15.9<br />
(g,%) 50g,<br />
10. Fruits<br />
100% 58.0<br />
11. Vitamin Cooking A (mcg oil/gata RE,%) 458mcg,<br />
100% 19.8 *<br />
12. Iron Milk (mg, %)<br />
12mg,
Sample menu for food basket for a family of 6, urban “bottom 30%<br />
income group”<br />
1. Rice<br />
2. Bread<br />
3. Pork<br />
4. Dried fish<br />
5. Noodles<br />
6. Condiments<br />
7. Sugar<br />
8. Fruit<br />
9. Cooking oil/gata<br />
10. Kangkong/<br />
malunggay/<br />
kamote tops/<br />
gabi leaves<br />
2442.0 g<br />
108.0<br />
180.0<br />
126.0<br />
46.2<br />
104.4<br />
37.2<br />
405.0<br />
93.0<br />
180.0<br />
Breakfast<br />
Dried fish<br />
Boiled rice<br />
Coffee w/ sugar<br />
Lunch<br />
Noodle soup<br />
Laing<br />
Boiled rice<br />
Banana<br />
Supper<br />
Pork sinigang<br />
w/ kangkong,<br />
kamote tops<br />
Boiled rice<br />
Snack<br />
Bread
Food thresholds derived from “all income group”<br />
and “bottom 30% income group” food baskets<br />
Urban<br />
Rural<br />
All<br />
All income<br />
group<br />
P 20.43<br />
P 18.26<br />
P 19.80<br />
Bottom 30%<br />
income group<br />
P 17.59<br />
(P 2.84)<br />
P 16.69<br />
(P 1.57)<br />
P 17.02<br />
(P 2.78)<br />
Official estimate P 25.14
Food thresholds derived from “all income group”<br />
and “bottom 30% income group” unadjusted food<br />
baskets vs. official estimate<br />
Urban<br />
Rural<br />
All<br />
All income<br />
group<br />
P 50.14<br />
P 35.12<br />
P 41.88<br />
Bottom 30%<br />
income group<br />
P 42.40<br />
(P7.74)<br />
P 29.73<br />
(P5.39)<br />
P 33.73<br />
(P8.15)<br />
Official estimate<br />
P 25.14
Incidence of food poverty based on food<br />
thresholds derived from “all income group” and<br />
bottom 30% income group” vs. official estimate<br />
Urban<br />
Rural<br />
All<br />
All income<br />
group<br />
5.4%<br />
13.9%<br />
10.1%<br />
Bottom 30%<br />
income group<br />
2.8%<br />
9.7%<br />
5.7%<br />
Official estimate 33.7%
Incidence of food poverty based on unadjusted<br />
food thresholds derived from “all income group”<br />
and “bottom 30% income group” 1<br />
Urban<br />
Rural<br />
All<br />
All income<br />
group<br />
39.2%<br />
55.5%<br />
44.6%<br />
Bottom 30%<br />
income group<br />
13.8%<br />
32.7%<br />
21.5%<br />
Official estimate 33.7%
Sensitivity and specificity of estimated food thresholds for<br />
identifying and classifying households who are food poor/not<br />
food poor 1 25.2% 98.9%<br />
Domain<br />
Sensitivity Specificity<br />
Urban<br />
“all income”<br />
“bottom 30%”<br />
Rural<br />
“all income”<br />
“bottom 30%”<br />
All<br />
“all income”<br />
“bottom 30%”<br />
15.8% 100.0%<br />
27.0% 98.1%<br />
20.2% 100.0%<br />
29.9% 98.3%<br />
18.9% 100.0%<br />
1 Food-poor households was defined as those households with total expenditure
Sensitivity and specificity of estimated food thresholds<br />
(unadjusted) for identifying and classifying households who are<br />
food poor/not food poor 1 84.6% 70.6%<br />
Domain<br />
Sensitivity Specificity<br />
Urban<br />
“all income”<br />
“bottom 30%”<br />
Rural<br />
“all income”<br />
“bottom 30%”<br />
All<br />
“all income”<br />
“bottom 30%”<br />
77.1% 100.0%<br />
78.5% 65.5%<br />
68.5% 100.0%<br />
82.7% 71.8%<br />
71.7% 100.0%<br />
1 Food-poor households was defined as those households with total expenditure
Discussion<br />
1. “all income group” vs. “bottom 30% income group”<br />
- The food basket of the “all income group” is more<br />
diverse, resulting to higher food cost / inflated food<br />
threshold, than that of the “bottom 30% income group.”<br />
- The estimates of food poor tend to be inflated when food<br />
threshold is derived from the food basket of the “all<br />
income group” compared to “bottom 30% income group”<br />
- 92% higher for incidence of urban food poor, 43%<br />
higher for incidence of rural food poor, 77% higher for<br />
the overall incidence of food poverty.
2. Food basket vs. actual foods consumed<br />
(unadjusted)<br />
- food baskets or lumping of food items into groups vs.<br />
actual foods consumed (unadjusted “food basket”)<br />
tends to lower the validity (sensitivity and specificity) of<br />
food poverty estimates
3. Arguments for the nutrition standard of 100%<br />
energy and protein and 80% for other vitamins and<br />
minerals, vs 100% energy<br />
- RDAs are levels of intakes of energy and essential nutrients<br />
considered adequate to maintain health and provide<br />
reasonable levels of reserves (20% margin of safety) in body<br />
tissues<br />
- reference indiv in the formulation of the RDA (energy) is one<br />
engaged in moderate physical activity, which reflects the level of<br />
activity for occupations the lower econ strata usually engage in<br />
- the RDA levels may not even be adequate under extreme<br />
environmental conditions, nor to cover additional requirements<br />
resulting from abnormal conditions. The poor are subjected to<br />
adverse environmental conditions