ANALYSIS OF FOOD CONSUMPTION DATA IN THE ... - NSCB
ANALYSIS OF FOOD CONSUMPTION DATA IN THE ... - NSCB
ANALYSIS OF FOOD CONSUMPTION DATA IN THE ... - NSCB
SHOW LESS

You also want an ePaper? Increase the reach of your titles
YUMPU automatically turns print PDFs into web optimized ePapers that Google loves.
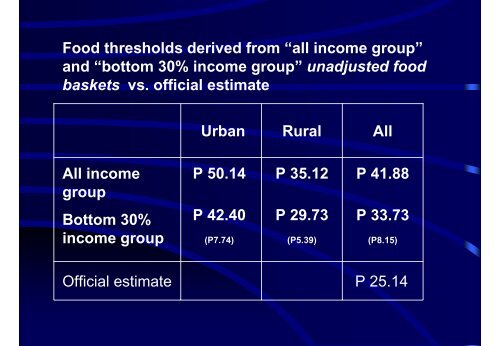
Food thresholds derived from “all income group”<br />
and “bottom 30% income group” unadjusted food<br />
baskets vs. official estimate<br />
Urban<br />
Rural<br />
All<br />
All income<br />
group<br />
P 50.14<br />
P 35.12<br />
P 41.88<br />
Bottom 30%<br />
income group<br />
P 42.40<br />
(P7.74)<br />
P 29.73<br />
(P5.39)<br />
P 33.73<br />
(P8.15)<br />
Official estimate<br />
P 25.14