ANALYSIS OF FOOD CONSUMPTION DATA IN THE ... - NSCB
ANALYSIS OF FOOD CONSUMPTION DATA IN THE ... - NSCB
ANALYSIS OF FOOD CONSUMPTION DATA IN THE ... - NSCB

You also want an ePaper? Increase the reach of your titles
YUMPU automatically turns print PDFs into web optimized ePapers that Google loves.
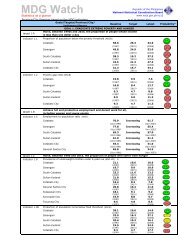
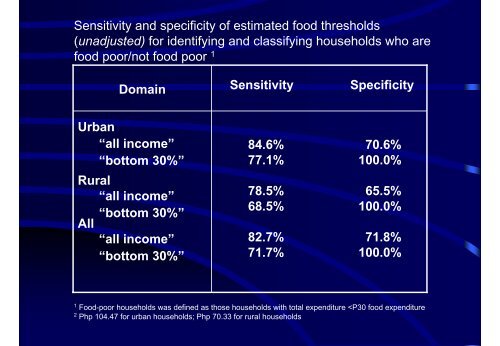
Sensitivity and specificity of estimated food thresholds<br />
(unadjusted) for identifying and classifying households who are<br />
food poor/not food poor 1 84.6% 70.6%<br />
Domain<br />
Sensitivity Specificity<br />
Urban<br />
“all income”<br />
“bottom 30%”<br />
Rural<br />
“all income”<br />
“bottom 30%”<br />
All<br />
“all income”<br />
“bottom 30%”<br />
77.1% 100.0%<br />
78.5% 65.5%<br />
68.5% 100.0%<br />
82.7% 71.8%<br />
71.7% 100.0%<br />
1 Food-poor households was defined as those households with total expenditure