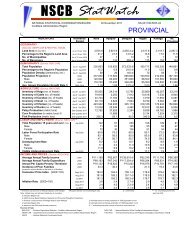
ANALYSIS OF FOOD CONSUMPTION DATA IN THE ... - NSCB
ANALYSIS OF FOOD CONSUMPTION DATA IN THE ... - NSCB
ANALYSIS OF FOOD CONSUMPTION DATA IN THE ... - NSCB

Create successful ePaper yourself
Turn your PDF publications into a flip-book with our unique Google optimized e-Paper software.
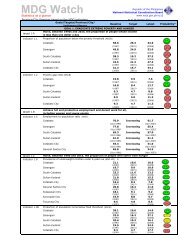
Discussion<br />
1. “all income group” vs. “bottom 30% income group”<br />
- The food basket of the “all income group” is more<br />
diverse, resulting to higher food cost / inflated food<br />
threshold, than that of the “bottom 30% income group.”<br />
- The estimates of food poor tend to be inflated when food<br />
threshold is derived from the food basket of the “all<br />
income group” compared to “bottom 30% income group”<br />
- 92% higher for incidence of urban food poor, 43%<br />
higher for incidence of rural food poor, 77% higher for<br />
the overall incidence of food poverty.