Ground Truth Studies Teacher Handbook - Aspen Global Change ...
Ground Truth Studies Teacher Handbook - Aspen Global Change ...
Ground Truth Studies Teacher Handbook - Aspen Global Change ...

Create successful ePaper yourself
Turn your PDF publications into a flip-book with our unique Google optimized e-Paper software.
A <strong>Global</strong> <strong>Change</strong> Primer (continued)<br />
ground level also has adverse affects on trees, and is thus implicated in the degradation and decline of forests. Tropospheric<br />
ozone is thus the “bad ozone,” not to be confused with the “good ozone” in the stratosphere, which protects life<br />
from excess ultraviolet radiation.<br />
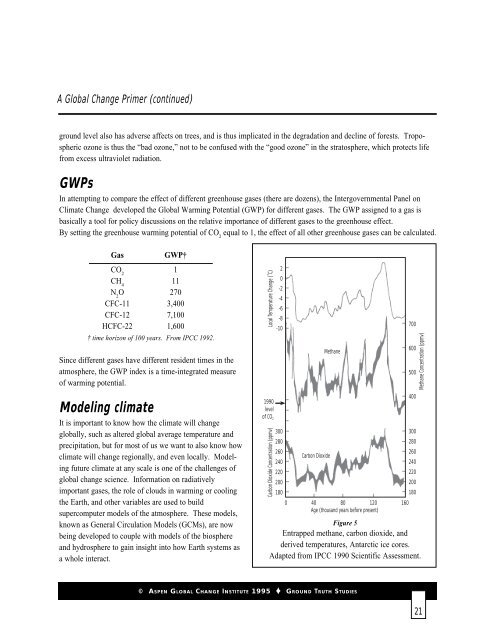
GWPs<br />
In attempting to compare the effect of different greenhouse gases (there are dozens), the Intergovernmental Panel on<br />
Climate <strong>Change</strong> developed the <strong>Global</strong> Warming Potential (GWP) for different gases. The GWP assigned to a gas is<br />
basically a tool for policy discussions on the relative importance of different gases to the greenhouse effect.<br />
By setting the greenhouse warming potential of CO 2<br />
equal to 1, the effect of all other greenhouse gases can be calculated.<br />
Gas<br />
GWP†<br />
CO 2<br />
1<br />
CH 4<br />
11<br />
N 2<br />
O 270<br />
CFC-11 3,400<br />
CFC-12 7,100<br />
HCFC-22 1,600<br />
† time horizon of 100 years. From IPCC 1992.<br />
Since different gases have different resident times in the<br />
atmosphere, the GWP index is a time-integrated measure<br />
of warming potential.<br />
Modeling climate<br />
It is important to know how the climate will change<br />
globally, such as altered global average temperature and<br />
precipitation, but for most of us we want to also know how<br />
climate will change regionally, and even locally. Modeling<br />
future climate at any scale is one of the challenges of<br />
global change science. Information on radiatively<br />
important gases, the role of clouds in warming or cooling<br />
the Earth, and other variables are used to build<br />
supercomputer models of the atmosphere. These models,<br />
known as General Circulation Models (GCMs), are now<br />
being developed to couple with models of the biosphere<br />
and hydrosphere to gain insight into how Earth systems as<br />
a whole interact.<br />
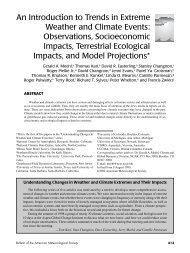
Local Temperature <strong>Change</strong> (˚C)<br />
2<br />
0<br />
-2<br />
-4<br />
-6<br />
-8<br />
-10<br />
of CO 2<br />
400<br />
1990<br />
level<br />
300<br />
280<br />
260<br />
240<br />
220<br />
200<br />
180<br />
Carbon Dioxide<br />
300<br />
280<br />
260<br />
240<br />
220<br />
200<br />
180<br />
0 40 80 120 160<br />
Age (thousand years before present)<br />
Figure 5<br />
Carbon Dioxide Concentration (ppmv)<br />
Methane<br />
Entrapped methane, carbon dioxide, and<br />
derived temperatures, Antarctic ice cores.<br />
Adapted from IPCC 1990 Scientific Assessment.<br />
700<br />
600<br />
500<br />
Methane Concentration (ppmv)<br />
© ASPEN GLOBAL CHANGE INSTITUTE 1995 GROUND TRUTH STUDIES<br />
21

![View Powerpoint Slides [PDF]](https://img.yumpu.com/32486693/1/190x146/view-powerpoint-slides-pdf.jpg?quality=85)

![View Powerpoint Slides [PDF]](https://img.yumpu.com/29411106/1/190x143/view-powerpoint-slides-pdf.jpg?quality=85)