Ground Truth Studies Teacher Handbook - Aspen Global Change ...
Ground Truth Studies Teacher Handbook - Aspen Global Change ...
Ground Truth Studies Teacher Handbook - Aspen Global Change ...

Create successful ePaper yourself
Turn your PDF publications into a flip-book with our unique Google optimized e-Paper software.
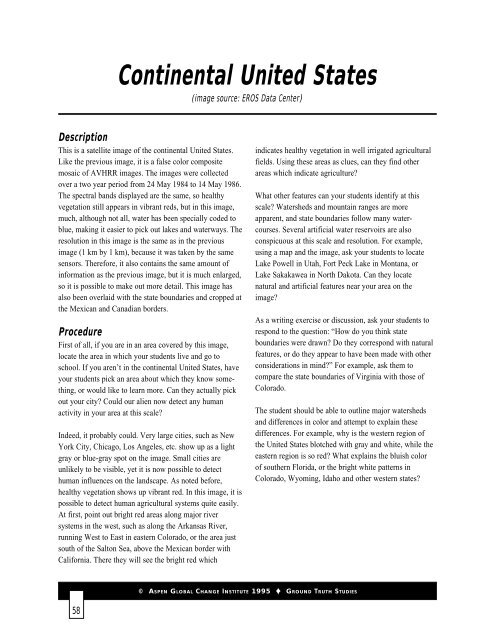
Continental United States<br />
(image source: EROS Data Center)<br />
Description<br />
This is a satellite image of the continental United States.<br />
Like the previous image, it is a false color composite<br />
mosaic of AVHRR images. The images were collected<br />
over a two year period from 24 May 1984 to 14 May 1986.<br />
The spectral bands displayed are the same, so healthy<br />
vegetation still appears in vibrant reds, but in this image,<br />
much, although not all, water has been specially coded to<br />
blue, making it easier to pick out lakes and waterways. The<br />
resolution in this image is the same as in the previous<br />
image (1 km by 1 km), because it was taken by the same<br />
sensors. Therefore, it also contains the same amount of<br />
information as the previous image, but it is much enlarged,<br />
so it is possible to make out more detail. This image has<br />
also been overlaid with the state boundaries and cropped at<br />
the Mexican and Canadian borders.<br />
Procedure<br />
First of all, if you are in an area covered by this image,<br />
locate the area in which your students live and go to<br />
school. If you aren’t in the continental United States, have<br />
your students pick an area about which they know something,<br />
or would like to learn more. Can they actually pick<br />
out your city? Could our alien now detect any human<br />
activity in your area at this scale?<br />
Indeed, it probably could. Very large cities, such as New<br />
York City, Chicago, Los Angeles, etc. show up as a light<br />
gray or blue-gray spot on the image. Small cities are<br />
unlikely to be visible, yet it is now possible to detect<br />
human influences on the landscape. As noted before,<br />
healthy vegetation shows up vibrant red. In this image, it is<br />
possible to detect human agricultural systems quite easily.<br />
At first, point out bright red areas along major river<br />
systems in the west, such as along the Arkansas River,<br />
running West to East in eastern Colorado, or the area just<br />
south of the Salton Sea, above the Mexican border with<br />
California. There they will see the bright red which<br />
indicates healthy vegetation in well irrigated agricultural<br />
fields. Using these areas as clues, can they find other<br />
areas which indicate agriculture?<br />
What other features can your students identify at this<br />
scale? Watersheds and mountain ranges are more<br />
apparent, and state boundaries follow many watercourses.<br />
Several artificial water reservoirs are also<br />
conspicuous at this scale and resolution. For example,<br />
using a map and the image, ask your students to locate<br />
Lake Powell in Utah, Fort Peck Lake in Montana, or<br />
Lake Sakakawea in North Dakota. Can they locate<br />
natural and artificial features near your area on the<br />
image?<br />
As a writing exercise or discussion, ask your students to<br />
respond to the question: “How do you think state<br />
boundaries were drawn? Do they correspond with natural<br />
features, or do they appear to have been made with other<br />
considerations in mind?” For example, ask them to<br />
compare the state boundaries of Virginia with those of<br />
Colorado.<br />
The student should be able to outline major watersheds<br />
and differences in color and attempt to explain these<br />
differences. For example, why is the western region of<br />
the United States blotched with gray and white, while the<br />
eastern region is so red? What explains the bluish color<br />
of southern Florida, or the bright white patterns in<br />
Colorado, Wyoming, Idaho and other western states?<br />
© ASPEN GLOBAL CHANGE INSTITUTE 1995 GROUND TRUTH STUDIES<br />
58

![View Powerpoint Slides [PDF]](https://img.yumpu.com/32486693/1/190x146/view-powerpoint-slides-pdf.jpg?quality=85)

![View Powerpoint Slides [PDF]](https://img.yumpu.com/29411106/1/190x143/view-powerpoint-slides-pdf.jpg?quality=85)