FREE DVD
FREE DVD
FREE DVD

You also want an ePaper? Increase the reach of your titles
YUMPU automatically turns print PDFs into web optimized ePapers that Google loves.
d Card<br />
Specifications<br />
Input impedance:<br />
Input dynamic range:<br />
Amplifier current consumption:<br />
Optocoupler current consumption:<br />
Common mode rejection ratio (CMRR):<br />
Gain:<br />
Bandwidth:<br />
Recording rate:<br />
> 1 MΩ<br />
5 mV pp<br />
approximately 11 mA<br />
approx. 2.2 mA<br />
> 70 dB<br />
approx. 1,000 (60 dB)<br />
approx. 0.4 Hz to 35 Hz (depending<br />
on sound card)<br />
in practice unlimited,<br />
typically 60 kbyte per minute<br />
file for later analysis. Test data sets are<br />
also available on the Internet [1] from<br />
medical databases, and these can also<br />
be processed and displayed using the<br />
program.<br />
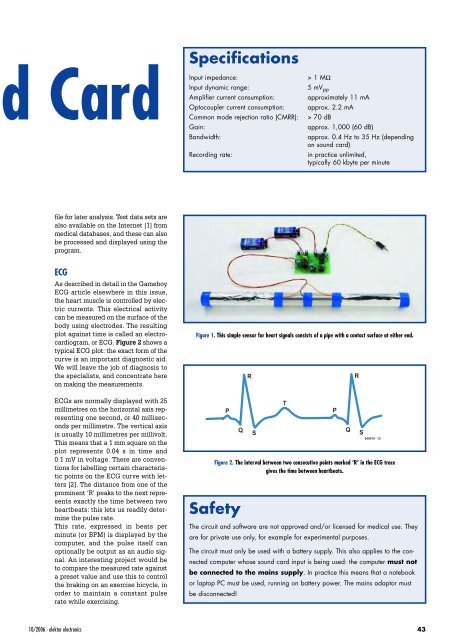
ECG<br />
As described in detail in the Gameboy<br />
ECG article elsewhere in this issue,<br />
the heart muscle is controlled by electric<br />
currents. This electrical activity<br />
can be measured on the surface of the<br />
body using electrodes. The resulting<br />
plot against time is called an electrocardiogram,<br />
or ECG. Figure 2 shows a<br />
typical ECG plot: the exact form of the<br />
curve is an important diagnostic aid.<br />
We will leave the job of diagnosis to<br />
the specialists, and concentrate here<br />
on making the measurements.<br />
ECGs are normally displayed with 25<br />
millimetres on the horizontal axis representing<br />
one second, or 40 milliseconds<br />
per millimetre. The vertical axis<br />
is usually 10 millimetres per millivolt.<br />
This means that a 1 mm square on the<br />
plot represents 0.04 s in time and<br />
0.1 mV in voltage. There are conventions<br />
for labelling certain characteristic<br />
points on the ECG curve with letters<br />
[2]. The distance from one of the<br />
prominent ‘R’ peaks to the next represents<br />
exactly the time between two<br />
heartbeats: this lets us readily determine<br />
the pulse rate.<br />
This rate, expressed in beats per<br />
minute (or BPM) is displayed by the<br />
computer, and the pulse itself can<br />
optionally be output as an audio signal.<br />
An interesting project would be<br />
to compare the measured rate against<br />
a preset value and use this to control<br />
the braking on an exercise bicycle, in<br />
order to maintain a constant pulse<br />
rate while exercising.<br />
Figure 1. This simple sensor for heart signals consists of a pipe with a contact surface at either end.<br />
P<br />
Safety<br />
R<br />
T<br />
Q S<br />
P<br />
040479 - 12<br />
Figure 2. The interval between two consecutive points marked ‘R’ in the ECG trace<br />
gives the time between heartbeats.<br />
The circuit and software are not approved and/or licensed for medical use. They<br />
are for private use only, for example for experimental purposes.<br />
The circuit must only be used with a battery supply. This also applies to the connected<br />
computer whose sound card input is being used: the computer must not<br />
be connected to the mains supply. In practice this means that a notebook<br />
or laptop PC must be used, running on battery power. The mains adaptor must<br />
be disconnected!<br />
Q<br />
R<br />
S<br />
10/2006 - elektor electronics 43