FREE DVD
FREE DVD
FREE DVD

Create successful ePaper yourself
Turn your PDF publications into a flip-book with our unique Google optimized e-Paper software.
TECHNOLOGY<br />
DEVELOPMENT ENVIRONMENT<br />
only the relevant information is presented. Each perspective,<br />
in turn, is itself built up from different views and editors.<br />
An editor is usually in the middle of the screen and is<br />
used to change the code. A view gives additional information<br />
over (or the properties of) a particular part in a<br />
graphical way. Although the concept of perspectives can<br />
look rather abstract at first glance, you will get used to it<br />
quickly once you start to work with it. Within each perspective<br />
just about everything can be configured as<br />
desired, such as the selection, position, arrangement of<br />
the different views and editors. In this way you always<br />
have the appropriate information at your fingertips that is<br />
the most relevant to you at that time.<br />
Getting started with Java<br />
Eclipse is eminently suitable as a development environment<br />
for Java-applications. With this there is a central<br />
role for the Java-perspective. At the far left we find the socalled<br />
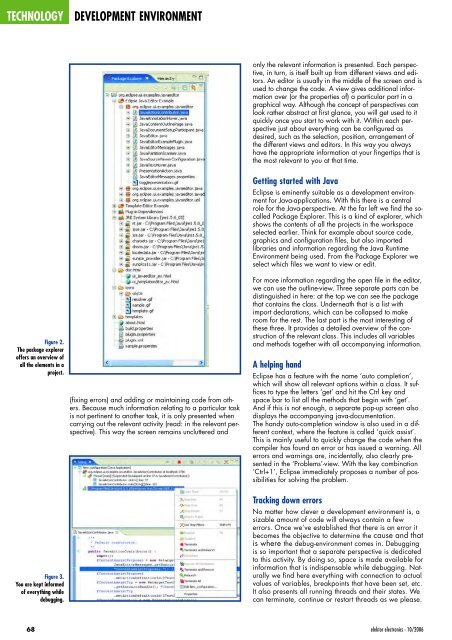
Package Explorer. This is a kind of explorer, which<br />
shows the contents of all the projects in the workspace<br />
selected earlier. Think for example about source code,<br />
graphics and configuration files, but also imported<br />
libraries and information regarding the Java Runtime<br />
Environment being used. From the Package Explorer we<br />
select which files we want to view or edit.<br />
Figure 2.<br />
The package explorer<br />
offers an overview of<br />
all the elements in a<br />
project.<br />
(fixing errors) and adding or maintaining code from others.<br />
Because much information relating to a particular task<br />
is not pertinent to another task, it is only presented when<br />
carrying out the relevant activity (read: in the relevant perspective).<br />
This way the screen remains uncluttered and<br />
For more information regarding the open file in the editor,<br />
we can use the outline-view. Three separate parts can be<br />
distinguished in here: at the top we can see the package<br />
that contains the class. Underneath that is a list with<br />
import declarations, which can be collapsed to make<br />
room for the rest. The last part is the most interesting of<br />
these three. It provides a detailed overview of the construction<br />
of the relevant class. This includes all variables<br />
and methods together with all accompanying information.<br />
A helping hand<br />
Eclipse has a feature with the name ‘auto completion’,<br />
which will show all relevant options within a class. It suffices<br />
to type the letters ‘get’ and hit the Ctrl key and<br />
space bar to list all the methods that begin with ‘get’.<br />
And if this is not enough, a separate pop-up screen also<br />
displays the accompanying java-documentation.<br />
The handy auto-completion window is also used in a different<br />
context, where the feature is called ‘quick assist’.<br />
This is mainly useful to quickly change the code when the<br />
compiler has found an error or has issued a warning. All<br />
errors and warnings are, incidentally, also clearly presented<br />
in the ‘Problems’-view. With the key combination<br />
‘Ctrl+1’, Eclipse immediately proposes a number of possibilities<br />
for solving the problem.<br />
Figure 3.<br />
You are kept informed<br />
of everything while<br />
debugging.<br />
Tracking down errors<br />
No matter how clever a development environment is, a<br />
sizable amount of code will always contain a few<br />
errors. Once we’ve established that there is an error it<br />
becomes the objective to determine the cause and that<br />
is where the debug-environment comes in. Debugging<br />
is so important that a separate perspective is dedicated<br />
to this activity. By doing so, space is made available for<br />
information that is indispensable while debugging. Naturally<br />
we find here everything with connection to actual<br />
values of variables, breakpoints that have been set, etc.<br />
It also presents all running threads and their states. We<br />
can terminate, continue or restart threads as we please.<br />
68<br />
elektor electronics - 10/2006