ELAC Educational Master Plan - East Los Angeles College
ELAC Educational Master Plan - East Los Angeles College
ELAC Educational Master Plan - East Los Angeles College

You also want an ePaper? Increase the reach of your titles
YUMPU automatically turns print PDFs into web optimized ePapers that Google loves.
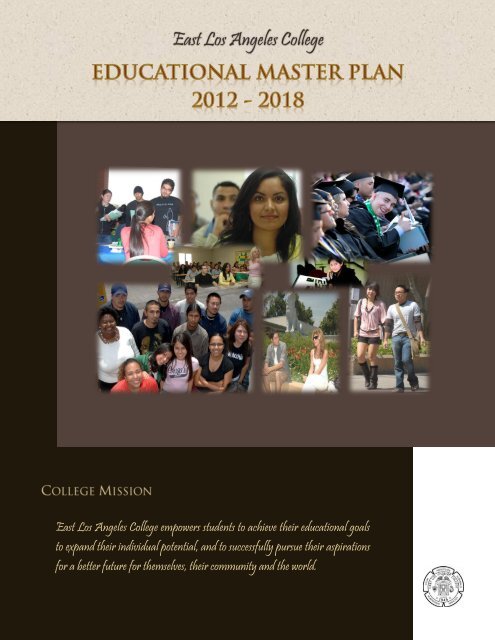
<strong>East</strong> <strong>Los</strong> <strong>Angeles</strong> <strong>College</strong><br />
<strong>East</strong> <strong>Los</strong> <strong>Angeles</strong> <strong>College</strong> empowers students to achieve their educational goals<br />
to expand their individual potential, and to successfully pursue their aspirations<br />
for a better future for themselves, their community and the world.
EPSC adopted July 17, 2012<br />
ESGC adopted September 24, 2012<br />
EAST LOS ANGELES COLLEGE<br />
EDUCATIONAL MASTER PLAN<br />
2012 – 2018
Administrative Members<br />
Board of Trustees<br />
Steve Veres, President<br />
Tina Park, First Vice President<br />
Nancy Pearlman, Second Vice President<br />
Kelly Candaele, Legislative Affairs<br />
Mona Field, Institutional Effectiveness<br />
Miguel Santiago, Capital Construction<br />
Scott J. Svonkin, Finance and Audit<br />
Daniel Campos, Student Trustee<br />
<strong>Los</strong> <strong>Angeles</strong> Community <strong>College</strong> District Administration<br />
Dr. Daniel J. LaVista, Chancellor<br />
Dr. Adriana D. Barrera, Deputy Chancellor<br />
Dr. Yasmin Delahousssaye, Vice Chancellor for <strong>Educational</strong> Programs and Institutional Effectiveness<br />
Dr. Felicito Cajayon, Vice Chancellor for Economic and Workforce Development<br />
Jeanette Gordon, Chief Financial Officer/Treasure<br />
Camille A. Goulet, General Counsel<br />
James D. O’Reilly, Executive Director, Facilities <strong>Plan</strong>ning and Development<br />
<strong>East</strong> <strong>Los</strong> <strong>Angeles</strong> <strong>College</strong> Administration<br />
Farley Herzek, Interim President<br />
Tom Furukawa, Vice President of Administrative Services<br />
Dr. Richard Moyer, Vice President of Liberal Arts and Sciences<br />
Laura M. Ramirez, Interim Vice President of Workforce Education and Economic Development<br />
Oscar Valeriano, Vice President of Student Services/Special Programs<br />
Jeremy Allred, Dean of Admissions and Records<br />
Gayle Brosseau, Dean of Academic Affairs<br />
Selina Chi, Dean of Resource Development/Community Relations<br />
Dr. Ryan Cornner, Dean of Institutional Effectiveness<br />
Danelle Fallert, Dean of Student Services<br />
Sonia Lopez, Dean of Student Services/Activities<br />
Vi Ly, Dean of Academic Affairs<br />
Kerrin McMahan, Dean of Academic Affairs<br />
Dr. Adrienne Anne Mullen, Dean of Continuing Education<br />
Al Rios, Dean of Academic Affairs/South Gate<br />
Angelica Toledo, Dean of CalWORKs<br />
Dr. John Rude, Associate Dean of Resource Development<br />
Martha Ermias, Assistant Dean of Grants Management<br />
Erlinda De Ocampo, Associate Vice President of Administrative Services<br />
Gonzalo Mendoza, Manager of <strong>College</strong> Information Systems<br />
Karen Rapp, Director of Vincent Price Art Museum
Acknowledgments<br />
<strong>Educational</strong> <strong>Plan</strong>ning Subcommittee<br />
Current and Past Members<br />
Pauletta Daw, Distance Education Coordinator<br />
Suzette Morales-Guerra, Matriculation Coordinator<br />
Amanda Ryan-Romo, Learning Assessment Coordinator<br />
Veronica Jaramillo, Learning Assessment Coordinator<br />
Steve Wardinski, Curriculum Committee Chair<br />
Cathleen Rozadilla, Articulation Officer<br />
Paulina Palomino, Transfer Director<br />
Ran Gust, Library Representative<br />
Dennis Villacorte, Noncredit Representative<br />
Daniel Ornelas, Chair of Counseling Department<br />
Gayane Godjoian, Career/Technical Faculty Representative<br />
Rahim Faradineh, Liberal Arts and Sciences Representative<br />
Alex Immerblum, Academic Senate President<br />
Jeff Hernandez, Academic Senate Representative<br />
Armando Rivera-Figueroa, AFT Representative<br />
Danelle Fallert, Dean of Student Services, EOP&S<br />
Al Rios, Dean of Offsite, South Gate<br />
Adrienne Ann Mullen, Dean of Academic Affairs<br />
Carol Kozeracki, Dean of Academic Affairs<br />
Karen Daar, Dean of Academic Affairs<br />
Richard Moyer, Vice President of Academic Affairs<br />
Laura M. Ramirez, Interim Vice President of Workforce Education and Economic Development<br />
Renee D. Martinez, Vice President of Workforce Education and Economic Development<br />
Oscar Valeriano, Vice President of Student Services<br />
Ryan Cornner, Dean of Institutional Effectiveness<br />
Special Thanks to the Office of Institutional Effectiveness for their valuable contributions in the development of the<br />
<strong>Educational</strong> <strong>Master</strong> <strong>Plan</strong>:<br />
Maribel Carbajal-Garcia, Sr. Office Assistant and José “Alfred” Gallegos, Research Analyst
Table of Contents<br />
COLLEGE HISTORY ........................................................................................................................................................................ 1<br />
COMMUNITY SUPPORT AND ENROLLMENT GROWTH ................................................................................................. 1<br />
CAMPUS TRANSFORMATION .................................................................................................................................................... 2<br />
COLLEGE PLANNING STRUCTURE .......................................................................................................................................... 3<br />
DEVELOPMENT OF THE EDUCATIONAL MASTER PLAN .............................................................................................. 5<br />
Overall Student Completion .................................................................................................................................................. 7<br />
How Successful Are Students When They Take the Class That They Are Placed Into? Can They Get<br />
Into That Placed Class? ......................................................................................................................................................... 10<br />
For Sequential Courses, How Does the Grade in the Previous Class Affect Success in Next Class? ...... 12<br />
What is the Success of Acceleration Models and Compression Models in Math and English<br />
Sequences? ................................................................................................................................................................................ 15<br />
What is the Success of Specialty Programs (Adelante, Puente, etc…)?............................................................. 15<br />
Adelante Data....................................................................................................................................................................... 15<br />
Athletics Data ....................................................................................................................................................................... 17<br />
Honors Data .......................................................................................................................................................................... 18<br />
Puente Data .......................................................................................................................................................................... 19<br />
How Successful are Students Who Pass English 101 in All Other Areas? ....................................................... 20<br />
Are Teachers Using Effective Practices/Pedagogy? ................................................................................................. 21<br />
Pedagogy Evaluation ......................................................................................................................................................... 21<br />
Suggested Methodology .................................................................................................................................................... 21<br />
What Courses Do New Students Taken in Their First Year? ................................................................................. 22<br />
What Do Enrollment Date (Fill Rate, Time of Day, Location) Say About Student Need? .......................... 23<br />
What is the Impact of Counseling on Student Success? .......................................................................................... 26<br />
How Effective is the Faculty Transfer Advisor? ......................................................................................................... 27<br />
How Does Financial Aid Impact Student Success? .................................................................................................... 27<br />
How Does Fulltime Status Impact a Student’s Success Rate? ............................................................................... 28<br />
Ongoing Data Needs .............................................................................................................................................................. 29<br />
EAST LOS ANGELES COLLEGE ............................................................................................................................................... 30<br />
Implementation and Evaluation ............................................................................................................................................ 41
COLLEGE HISTORY<br />
<strong>East</strong> <strong>Los</strong> <strong>Angeles</strong> <strong>College</strong> (<strong>ELAC</strong>) is a large urban college which serves more Latino students annually than<br />
any other community college in the California Community <strong>College</strong> System. <strong>ELAC</strong> serves an important role<br />
in its community through its academic, career-technical, noncredit, student support service and Public<br />
Service Academy programs. These offerings serve as gateways to a better life for many in the community<br />
and as a primary access point to higher education for a population that has traditionally been<br />
underrepresented in post-secondary education. <strong>ELAC</strong>’s primarily Hispanic/Latino and Asian/Pacific Islander<br />
student body reflects its service area population and is indicative of the college’s dedication to increasing<br />
access and success in higher education for underrepresented populations. The college offers a full spectrum<br />
of degree programs, career certificate programs, and transfer curriculum that allows students to successfully<br />
complete their educational goals. In addition, the college offers the opportunity for students to engage in an<br />
educational plan that promotes individual personal development. In this manner, <strong>ELAC</strong> represents the<br />
promise of new opportunities to the community and a gateway to success for many students.<br />
<strong>East</strong> <strong>Los</strong> <strong>Angeles</strong> Junior <strong>College</strong> was established in June 1945 by the <strong>Los</strong> <strong>Angeles</strong> City Board of Education.<br />
The college opened its doors for the Fall 1945 semester in September in a wing of Garfield High School,<br />
boasting nineteen faculty members and 117 students, many of whom were World War II veterans.<br />
The college quickly outgrew the borrowed high school facilities. In 1947, the Board of Education was able to<br />
purchase eighty-two acres of agricultural land in what was then <strong>East</strong> <strong>Los</strong> <strong>Angeles</strong>, thanks to funding from a<br />
bond issue. Two years later, in January 1949, classes began at the college’s present location in wooden<br />
bungalows moved to the campus from the Santa Ana Army Air Base. More than 1,700 students enrolled that<br />
year.<br />
An evening program that began in 1947 was expanded and offered at many locations. By 1954, the popular<br />
program offered classes at twenty-five different locations. The Civic Center program alone enrolled over<br />
1,900 students that year.<br />
In 1948 a name change was proposed. <strong>Angeles</strong> Bella Vista <strong>College</strong>, Ramona Hills <strong>College</strong> and Hillview<br />
<strong>College</strong> were considered. It wasn’t until 1959 that the name change occurred when the “Junior” was dropped<br />
and the name <strong>East</strong> <strong>Los</strong> <strong>Angeles</strong> <strong>College</strong> (<strong>ELAC</strong>) was firmly established.<br />
COMMUNITY SUPPORT AND ENROLLMENT GROWTH<br />
In 1951, the stadium and auditorium were built. Over the next twenty years permanent buildings were<br />
constructed to accommodate growing enrollment. More classrooms, an administration building, a library, a<br />
planetarium, men’s and women’s gyms, a swim stadium, a theater, and an art gallery – to name a few –<br />
followed.<br />
Today’s Vincent Price Art Museum began with a gift from Vincent Price – noted actor and art collector –<br />
who donated ninety pieces from his collection to establish the first “teaching art collection” in 1957. Over the<br />
years, the collection has grown to more than 9,000 pieces including works on paper, paintings and threedimensional<br />
art work. This collection provides an extraordinary and unique resource for students to see<br />
original art firsthand in order to supplement courses in art history and art appreciation.<br />
In 1969, the California State Legislature clearly defined higher education in the state and designated the<br />
(then) eight community colleges of the <strong>Los</strong> <strong>Angeles</strong> Unified School District as the <strong>Los</strong> <strong>Angeles</strong> Community<br />
<strong>College</strong> District (LACCD). A seven-member Board of Trustees was elected to govern the new district.<br />
Today, the <strong>ELAC</strong> service area, home to more than 1.5 million people, includes the communities of<br />
Alhambra, Bell, Bell Gardens, City of Commerce, Cudahy, <strong>East</strong> <strong>Los</strong> <strong>Angeles</strong>, Huntington Park, <strong>Los</strong><br />
<strong>Angeles</strong>, Maywood, Montebello, Monterey Park, Rosemead, San Gabriel, South San Gabriel, South Gate,<br />
and Vernon.<br />
1 Page <strong>Educational</strong> <strong>Master</strong> <strong>Plan</strong> 2012
During the 1970s, more buildings were added to the campus to keep up with growth of student enrollments.<br />
In 1975, the unduplicated enrollment count of credit students was 18,544. A gymnasium, including<br />
classrooms, a lecture hall, offices and lockers, and outdoor ball-court spaces were built in 1972. The swim<br />
stadium, with two twenty-five yard swimming pools, was also built that year. To house the nursing program<br />
a Nursing Education Building was built in 1977 and a new library followed two years later.<br />
In 1972, the City of Monterey Park annexed the <strong>College</strong> and surrounding neighborhood, officially changing<br />
the main campus address. <strong>ELAC</strong> began growing, adding faculty members, programs and classes as demand<br />
for higher education increased.<br />
During the 1984 Olympic Summer Games, <strong>ELAC</strong> hosted swimming and field hockey events, welcoming<br />
thousands of spectators to campus and increasing the international visibility of the <strong>College</strong>. Despite funding<br />
challenges that limited growth during the 1980s, <strong>ELAC</strong> continued to offer a variety of vocational and transfer<br />
programs.<br />
Throughout the 1990s the Automotive Technology and Child Development Centers were built. Many of the<br />
original bungalows were still used as classrooms until 2007 when they were finally demolished to make way<br />
for new campus structures.<br />
CAMPUS TRANSFORMATION<br />
During the 1990s <strong>ELAC</strong> experienced unprecedented growth and change. Enrollment grew from 13,000 to<br />
approximately 30,000 students and the number of permanent faculty almost doubled. Outreach programs<br />
were located throughout the service area for the convenience of students who could not easily travel to the<br />
main campus. In August 1997, the full-service South Gate <strong>Educational</strong> Center was established in the<br />
southern part of the service area so that students could complete a transfer curriculum and several career<br />
programs without attending the main campus. In 2007, a third site was opened in Rosemead to serve students<br />
in the northeastern portion of <strong>ELAC</strong>’s service area.<br />
Growth during the first decade of the 21st century was not limited to increasing enrollment. An emphasis on<br />
student-centered education and on providing support that engendered student success increased <strong>ELAC</strong>’s<br />
graduation numbers. Between 2000 and 2005, <strong>East</strong> <strong>Los</strong> <strong>Angeles</strong> <strong>College</strong> graduated the highest number of<br />
Hispanics/Latinos in California. Nationwide, in 2011, <strong>ELAC</strong>, ranked 6th, continued to be one of the highest<br />
Associate Degree producers of Hispanics/Latinos.<br />
In 2000, two bond issues, Propositions A and AA, initiated by the LACCD, were approved by voters.<br />
Funding of over $281 million allowed <strong>ELAC</strong> to begin the most ambitious building program in its history to<br />
substantially improve the <strong>College</strong>’s infrastructure. In the fall of 2004, a state-of-the-art technology building<br />
opened that was started with state funds and completed with bond money. This building was the first of many<br />
buildings and improvements that are planned or under construction.<br />
By the spring of 2011, after almost a decade of planning and construction, more than 240,000 square feet of<br />
classroom, student services and administrative space were added to the college facilities. In addition to<br />
buildings, a 1,800 space parking structure was constructed to provide access to the heart of the campus. The<br />
Baum Center, located on the east side of the college’s new entry plaza, was remodeled to be a comprehensive<br />
facility for administrative services, complete with a six-room faculty conference center. Across the entry<br />
plaza is the newly completed Student Services Center that houses admissions, testing, counseling, and<br />
financial services under one roof to maximize student access to enrollment services.<br />
The Visual and Performing Arts Center, a $65 million, three-building complex located at the eastern gateway<br />
to the campus, is anchored by a 77,000 square feet two-story building that is now home to the Dance, Music,<br />
and Visual Arts disciplines. The Theater Department is housed separately in a two-story building that<br />
2 Page <strong>Educational</strong> <strong>Master</strong> <strong>Plan</strong> 2012
includes a traditional proscenium stage theater and a flexible black box performing space. The facility also<br />
includes workshops for costuming and stage design as well as classrooms to allow for instruction to occur<br />
simultaneously with performance preparation. The Vincent Price Art Museum, the third building in the<br />
center, is equipped with seven galleries, the Thomas Silliman Vault for storing the collection, and a 129-seat<br />
“smart” lecture hall to accommodate art history classes and guest lectures.<br />
Currently, construction continues on a replacement classroom building, the renovation of the Helen Miller<br />
Bailey Library, a second 1,500 space parking structure located on the northeast corner of the campus, a<br />
Transit Mall, and modernization of the sports stadiums and playing fields. In addition, an off-campus<br />
building in nearby Corporate Center has been purchased and is undergoing renovation to serve as the Health<br />
Careers Center.<br />
Funding from a third bond approved in 2008 will continue campus transformation into the coming decade.<br />
The South Gate <strong>Educational</strong> Center acquired a 19-acre site across the street from its current location. The<br />
new site, which is projected to open in 2015, will be developed into a campus complete with a parking<br />
structure, a new classroom building and a retrofitted space that will accommodate various student services.<br />
On the main campus, plans for a Science Career & Mathematics Building, Student Success and Retention<br />
Center, Campus Student Center/Bookstore and gardens, plazas, and additional classrooms are moving<br />
towards approval and construction. With these enhancements, <strong>East</strong> <strong>Los</strong> <strong>Angeles</strong> <strong>College</strong> will be positioned to<br />
provide the highest quality education and services to its students and community for decades to come.<br />
COLLEGE PLANNING STRUCTURE<br />
The strategic planning structure at <strong>ELAC</strong> reflects the college’s commitment to shared governance and to<br />
obtaining campus‐wide and community input on college goals and objectives that will shape the college’s<br />
future. The <strong>ELAC</strong> Shared Governance Council (ESGC) serves as the central governing body for all planning<br />
decisions and makes recommendations directly to the college president as part of the shared governance<br />
process. In addition to the ESGC, the Strategic <strong>Plan</strong>ning Committee (SPC), <strong>Educational</strong> <strong>Plan</strong>ning<br />
Subcommittee (EPSC), Facilities <strong>Plan</strong>ning Subcommittee (FPSC), Technology <strong>Plan</strong>ning Subcommittee<br />
(TPSC), Program Review and Viability Committee (PRVC), and the Budget Committee also play key roles<br />
in the development and implementation of the college planning agenda. The Office of Institutional<br />
Effectiveness (OIE) facilitates the development of the college planning documents and assists in the<br />
implementation and evaluation of the planning agenda.<br />
3 Page <strong>Educational</strong> <strong>Master</strong> <strong>Plan</strong> 2012
Academic Senate<br />
<strong>ELAC</strong> Shared Governance Council<br />
Budget<br />
Committee<br />
Strategic <strong>Plan</strong>ning<br />
Committee<br />
<strong>Educational</strong><br />
<strong>Plan</strong>ning<br />
Subcommittee<br />
Facilities <strong>Plan</strong>ning<br />
Subcommittee<br />
Technology<br />
<strong>Plan</strong>ning<br />
Subcommittee<br />
Program Review<br />
and Viabilility<br />
Committee<br />
Distance<br />
Education<br />
Committee<br />
Enrollment<br />
Management<br />
Committee<br />
Matriculation<br />
Advisory<br />
Committee<br />
Off-Site<br />
Committee<br />
Learning<br />
Assessment<br />
Committee<br />
Student Success<br />
Committee<br />
Transfer<br />
Committee<br />
Figure 1: <strong>ELAC</strong> <strong>Plan</strong>ning Structure<br />
All college planning agendas are created through data-driven processes that include national, state, local, and<br />
campus-level data. The Office of Institutional Effectiveness provides comprehensive college data on student<br />
outcomes and college core indicators of success. The college is also guided by the objectives set forth in the<br />
District Strategic <strong>Plan</strong>. Through the use of quantitative and qualitative data, and the direction of the District<br />
Strategic <strong>Plan</strong>, the college regularly reviews its own strategic and planning objectives. In addition, the<br />
Program Review process is used to substantiate the efforts made by departments to improve student learning<br />
and to identify the needs of <strong>ELAC</strong> students and the surrounding community. The Program Review and<br />
Viability Committee reviews and updates the college’s Program Review <strong>Plan</strong> every six years. This plan<br />
includes the schedule for conducting Comprehensive Program Review and Annual Update <strong>Plan</strong>s. The<br />
Comprehensive Program Review Questionnaire focuses on the manner in which each program is supporting<br />
the agenda items listed in the Strategic <strong>Plan</strong>. In addition, the Comprehensive Program Review and Annual<br />
Update <strong>Plan</strong>s utilize Learning Outcomes to assess the degree to which departments and programs are<br />
working to improve the student learning process and creating improvements in student outcomes. Annual<br />
Update <strong>Plan</strong>s are completed in between comprehensive reviews to determine the progress made in<br />
responding to Comprehensive Program Review recommendations and the program or department’s own unit<br />
goals. The Annual Update <strong>Plan</strong>s serve as the basis for resource allocation decisions, such as hiring of new<br />
faculty and staff, purchase of new equipment, and increases or decreases to a unit’s base budget. The<br />
Comprehensive Program Review and Annual Update <strong>Plan</strong>s provide essential data in the development,<br />
implementation, and evaluative planning processes.<br />
All college planning is conducted using evaluation cycles focused on continuous quality improvement for all<br />
instruction, student services, and administrative programs. <strong>ELAC</strong> enters into six-year planning cycles in<br />
which the college progresses through phases of <strong>Plan</strong>ning, Implementation, and Evaluation (PIE). By<br />
incorporating formative evaluations into operational decision-making, <strong>ELAC</strong> ensures that these annual<br />
processes are subject to self-reflective examination on an ongoing basis and that lessons learned contribute to<br />
improvements in these processes. Data-driven measures and formative evaluations contribute to a summative<br />
evaluation of the strategic plan implementation at the end of its six-year cycle. The link between the<br />
formative evaluations and summative evaluation ensures that continuous quality improvement is ongoing and<br />
is the driving force for revisions to the strategic plan. Through this model, the college ensures that all<br />
programs, as well as the college’s governing and decision-making processes, are regularly and thoroughly<br />
evaluated.<br />
4 Page <strong>Educational</strong> <strong>Master</strong> <strong>Plan</strong> 2012
The Strategic <strong>Plan</strong>ning Committee (SPC) is a standing committee that serves to regularly review and revise<br />
the <strong>College</strong>’s Mission, Vision, and Strategic Goals as needed. Membership on this committee ensures<br />
representation from all vital constituent groups and those with the requisite knowledge to formulate the<br />
college planning agenda. The SPC is responsible for overseeing the implementation process of the strategic<br />
and master plans and reviewing ongoing formative evaluations. The committee is convened every six years<br />
for a formal review of the college’s current planning agendas and relevant data in order to determine if<br />
revisions are needed and, should it be determined to be warranted, construct a revised <strong>College</strong> Mission and<br />
Strategic <strong>Plan</strong>. The committee works to ensure that there is a thorough evaluation of the current planning<br />
agendas and that the Strategic <strong>Plan</strong> includes a review of all relevant data. To this end, the committee reviews<br />
a standard set of vital data elements and meets to select additional elements that are deemed needed for the<br />
college’s planning efforts. The standard data elements include:<br />
1. District and state strategic plans<br />
2. The formative evaluations and implementation history of the previous strategic plan<br />
3. The college external scan, internal scan, college profile, and core indicators<br />
4. Student surveys<br />
5. Comprehensive program review and annual update results<br />
6. Program learning outcomes and college core competencies to institutional learning outcomes<br />
7. Any additional information relevant to the revision of the strategic plan<br />
The goals developed for the Strategic <strong>Plan</strong> serve as broad objectives that all areas of the institution should<br />
strive to meet. In this manner, these goals serve as guidance in the development of specific college plans as<br />
well as those actions planned through the departmental or unit specific efforts. Each planning subcommittee<br />
(<strong>Educational</strong>, Technology, and Facilities) creates objectives or planned actions that will lead to the<br />
fulfillment of the Strategic Goals.<br />
DEVELOPMENT OF THE EDUCATIONAL MASTER PLAN<br />
The <strong>Educational</strong> <strong>Master</strong> <strong>Plan</strong> is created by the <strong>Educational</strong> <strong>Plan</strong>ning Subcommittee (EPSC). The EPSC<br />
operates under the auspices of the Academic Senate and is made up of college faculty, administrators, staff,<br />
and students. The committee serves as the central planning committee for all educational matters, including<br />
those administrative and student service areas that overlap with or support educational goals. The purpose of<br />
the EPSC is to complete the <strong>Educational</strong> <strong>Master</strong> <strong>Plan</strong>, determine the needs of the college, and make<br />
recommendations of its revisions and funding for components from ESGC. The EPSC discusses and makes<br />
recommendations regarding academic matters related to educational programming, including issues related<br />
to enrollment. In order to include relevant leadership committees related to the educational needs of students,<br />
the following committees report to the EPSC: Distance Education Committee, Enrollment Management<br />
Committee, Matriculation Advisory Committee, Off-Site Committee, Student Learning Outcomes<br />
Committee; Student Success Committee, and Transfer Committee.<br />
The <strong>Educational</strong> <strong>Master</strong> <strong>Plan</strong> serves as the college’s guiding strategy on educational issues and seeks to<br />
fulfill the <strong>College</strong> Mission and Strategic Goals through the implementation of educational objectives. These<br />
objectives are broad-based principles that can serve as guidance for all departments and units on campus.<br />
Furthermore, these objectives are used in the Program Review process to assist departments and units in<br />
establishing relevant plans that will lead the college to the fulfillment of its <strong>Educational</strong> <strong>Master</strong> <strong>Plan</strong> and<br />
consequently its Strategic <strong>Plan</strong> and <strong>College</strong> Mission. Each activity undertaken by departments or units will<br />
be aligned with the stated <strong>Educational</strong> <strong>Master</strong> <strong>Plan</strong> objectives and tracked to determine their overall<br />
effectiveness in improving targeted measures of success. In addition, specific recommended actions are<br />
offered for objectives by the EPSC to provide focus and prioritization in college planning in a manner that<br />
will best lead the college to a successful completion of its Strategic Goals and associated targets.<br />
5 Page <strong>Educational</strong> <strong>Master</strong> <strong>Plan</strong> 2012
The EPSC began its planning work upon college approval of the Strategic <strong>Master</strong> <strong>Plan</strong> on May 23, 2011. To<br />
begin its evaluation cycle, the EPSC reviewed the Strategic <strong>Plan</strong> and the evidence used to develop the<br />
college’s Strategic Goals. All relevant data from this report was compiled to identify areas of focus for the<br />
<strong>Educational</strong> <strong>Master</strong> <strong>Plan</strong>. In addition, the committee created a list of questions to be answered in order to<br />
inform the development of the <strong>Educational</strong> objectives and action items. Driven by the concepts of Achieving<br />
the Dream (ATD), the college developed these data questions to determine why students are failing to meet<br />
educational milestones and academic goals. The committee also sought to identify successful elements of the<br />
college programs for use in developing planned actions during the current planning period. These data are<br />
used to drive the committee to strategies that directly target the underlying factors that inhibit academic<br />
success.<br />
Data Areas –Why Questions<br />
How successful are students when they take the class that they are placed into?<br />
Can they get into placed class?<br />
For sequential courses, how does the grade in the previous class effect success in next class?<br />
What is the success of acceleration models and compression models in math and English sequences?<br />
What is the success of specialty programs (Adelante, Puente, etc…)?<br />
How successful are students who pass English 101 in all other areas?<br />
Are teachers using effective practices/pedagogy?<br />
What courses do new students take in their first year?<br />
What do enrollment data (fill rate, time of day, location) say about student need?<br />
What is the impact of counseling on student success?<br />
How effective is the faculty transfer advisor?<br />
How does financial aid impact student success?<br />
How does fulltime status impact a student’s success rate?<br />
What data exist to inform curriculum development?<br />
Why are students completing 0 units in first semester?<br />
How well do GE and transfer requirements align?<br />
Why do students fail to get an AA degree?<br />
Lack of accessibility<br />
Lack of knowledge of direction<br />
AA has no value<br />
What data exists to prioritize reductions in a time of economic crisis?<br />
The committee met over the course of a year to review data and develop objectives based on the perceived<br />
needs of students. The following data provides a summary of the findings of the committee used through this<br />
process.<br />
6 Page <strong>Educational</strong> <strong>Master</strong> <strong>Plan</strong> 2012
% Students<br />
Overall Student Completion<br />
In an effort to inform campus discussions on the development of a new <strong>ELAC</strong> <strong>Educational</strong> <strong>Master</strong> <strong>Plan</strong>, the<br />
Office of Institutional Effectiveness (OIE) presented a cohort-based pipeline report on <strong>ELAC</strong> student<br />
progression over a 3 year period towards completion of a certificate, degree, or transfer to a 4-year<br />
university. “Leakage points” were identified that showed where students were most likely to be delayed in<br />
completing one of the above outcomes, and/or where they were most likely to leave the college altogether<br />
without completing.<br />
Cohort Analysis<br />
2007 Cohort 2008 Cohort<br />
N % N %<br />
Cohort 3,729 100.0% 4,127 100.0%<br />
Completed First Semester Units 2,539 68.1% 3,049 73.9%<br />
Fall to Spring Persistence 2,352 63.1% 2,784 67.5%<br />
Fall to Fall Persistence 1,980 53.1% 2,334 56.6%<br />
Completion of Math Competency 891 23.9% 988 23.9%<br />
Completion of English Competency 814 21.8% 959 23.2%<br />
Completion of Both English and Math Competency 563 15.1% 636 15.4%<br />
Completion of Degree, Certificate or Transfer 414 11.1% 417 10.1%<br />
Transfer to a Four-Year Institution 236 6.3% 198 4.8%<br />
Completion of an On-Campus Degree or Certificate 279 7.5% 310 7.5%<br />
100.0%<br />
90.0%<br />
80.0%<br />
70.0%<br />
60.0%<br />
50.0%<br />
40.0%<br />
30.0%<br />
20.0%<br />
10.0%<br />
0.0%<br />
100.0%<br />
100.0%<br />
Pipeline Comparison<br />
68.1%<br />
73.9%<br />
53.1%<br />
56.6%<br />
15.1% 11.1%<br />
15.4% 10.1% 6.3%<br />
4.8%<br />
7.5% 7.5%<br />
The initial data suggest that students are having great difficulty completing their educational goals within a<br />
three-year period. The committee determined that completion of units in the first semester of a student’s<br />
academic career has a tremendous impact on the overall completion rate. The initial cohort indicated that 32<br />
% of students withdrawal or fail all of their courses in their first semester. Further analysis indicated that<br />
these early setbacks have a substantial impact on overall completion. Failing to complete units the first<br />
semester reduce completion rate to 2.6% for the 2007 cohort and 1.2% for the 2008 cohort.<br />
7 Page <strong>Educational</strong> <strong>Master</strong> <strong>Plan</strong> 2012
Additionally, the committee found that completion of the English and math sequence was a substantial<br />
barrier to student success. The following data represent the impact of initial math and English placement on<br />
the overall completion of a degree, certificate or transfer program. The data indicate that students beginning<br />
lower in the English and math sequence succeed at a far lesser rate than those students placing at or able the<br />
college competency level (English 101 and Math 125).<br />
Cohort Analysis by First English<br />
First English 2008 Cohort Completions %<br />
Transfer Level 31 13 41.9%<br />
English 101 333 83 24.9%<br />
English 28/60s 614 87 14.2%<br />
English 26/57 527 58 11.0%<br />
English 21 492 35 7.1%<br />
Reading 20 275 17 6.2%<br />
ESL 384 53 13.8%<br />
Other Reading 57 3 5.3%<br />
None 1,414 68 4.8%<br />
Total 4,127 417 10.1%<br />
Cohort Analysis by First Math<br />
First Math 2008 Cohort Completions %<br />
Transfer Level 190 83 43.7%<br />
Math 120/125 420 104 24.8%<br />
Math 115 681 80 11.8%<br />
Math 110/112 1,155 79 6.8%<br />
Math 105 183 7 3.8%<br />
None 1,497 64 4.3%<br />
Other 1 0.0%<br />
Total 4,127 417 10.1%<br />
The initial success completion data led to additional analysis on the math and English sequences.<br />
Specifically, all students who took their first math course at <strong>ELAC</strong> in Fall 2008 were tracked through Spring<br />
2011 (n = 2,465). These students could be of any academic level, but must have begun their math sequence<br />
in Fall 2008. To ensure that students with different initial levels of math knowledge were not all grouped<br />
together, students were placed into cohorts based on their first math course at <strong>ELAC</strong> (i.e. Math 105, 110/112,<br />
115, 125, Transfer Level). For example, the progress of students whose first math class at <strong>ELAC</strong> was Math<br />
105 in Fall 2008 was tracked for three years. Students who began at Math 110/112 in Fall 2008 were grouped<br />
into a separate cohort and their progress was also tracked through three years. The data below illustrate<br />
success through the math sequence as a function of initial math level. In addition, the average number of<br />
attempts that students needed to pass each math course in the sequence was calculated for each cohort. It is<br />
clear from the data that a substantial number of students fail to complete the math sequence within three<br />
years and that the lower the starting point, the more likely the student is to fail to reach transfer level.<br />
Furthermore, students average nearly 1.5 attempts per level, adding significant time to completion for a large<br />
portion of the student body.<br />
8 Page <strong>Educational</strong> <strong>Master</strong> <strong>Plan</strong> 2012
Success<br />
Success Through Math Sequence Over Three Years by First Math Course Attempted at <strong>ELAC</strong><br />
Success in<br />
Success in<br />
Success in Success in<br />
Math<br />
Math 105<br />
Math 115 Math 125<br />
110/112<br />
N (%)<br />
N (%) N (%)<br />
N (%)<br />
First Math Course at<br />
<strong>ELAC</strong> (Fall 2008)<br />
Success in<br />
Transfer Level<br />
N (%)<br />
Math 105 (n = 167) 82 (49.1%) 50 (29.9%) 27 (16.2%) 11 (6.6%) 6 (3.6%)<br />
Math 110/112 (n=1003) 542 (54.0%) 300 (29.9%) 146 (14.6%) 57 (5.7%)<br />
Math 115 (n = 616) 414 (67.2%) 278 (45.1%) 151 (24.5%)<br />
Math 125 (n = 370) 248 (67.0%) 185 (50.0%)<br />
Transfer Level (n = 309) 162 (52.4%)<br />
Average Math Course Attempts Over Three Years by First Math Course Attempted at <strong>ELAC</strong><br />
First Math Course at <strong>ELAC</strong> (Fall 2008) Math 105 Math 110/112 Math 115 Math 125<br />
Math 105 (n = 167) 1.25 1.40 1.45 1.47<br />
Math 110/112 (n=1003) 1.34 1.48 1.41<br />
Math 115 (n = 616) 1.30 1.37<br />
Math 125 (n = 370) 1.21<br />
80.0%<br />
70.0%<br />
60.0%<br />
50.0%<br />
40.0%<br />
30.0%<br />
20.0%<br />
10.0%<br />
0.0%<br />
Math 105<br />
Success Through Math Sequence Over Three Years<br />
by First Math Course Attempted at <strong>ELAC</strong><br />
Math<br />
110/112<br />
Math 115 Math 125 Transfer<br />
Level<br />
Math Course Sequence Through Spring 2011<br />
First Math Course<br />
Attempted at <strong>ELAC</strong><br />
(Fall 2008)<br />
Math 105 (n = 167)<br />
Math 110/112 (n=1003)<br />
Math 115 (n = 616)<br />
Math 125 (n = 370)<br />
Transfer Level (n = 309)<br />
Using these initial completion figures as a base, the committee turned to a review of requested data.<br />
Through the Summer 2011 and Fall 2012 semesters, the EPSC met to refine its requests and prioritize the<br />
need for the data requested. In addition, the college’s Achieving the Dream Data Team reviewed elements<br />
of the data produced and assisted the Office of Institutional Effectiveness in developing appropriate data<br />
displays that are reflective of the college experience and that can be presented in a manner that informs<br />
college decision-makers. The final data are represented below.<br />
9 Page <strong>Educational</strong> <strong>Master</strong> <strong>Plan</strong> 2012
How Successful Are Students When They Take the Class That They Are Placed<br />
Into? Can They Get Into That Placed Class?<br />
The 2008-2011 <strong>Educational</strong> <strong>Master</strong> <strong>Plan</strong> called for the college to utilize computerized assessment<br />
processes. The collaborative work of the English and Math Departments led to the use of the Accuplacer<br />
and Compass assessment systems. The completion of this objective led to more effective placement and<br />
the removal of the referral process, which required an additional test during a separate testing period. The<br />
current testing procedures result in 88% of students testing below transfer-level in English and nearly<br />
93% of students testing below transfer-level in math.<br />
English Placement<br />
Placement Trends: English<br />
2007-2008 2008-2009 2009-2010 2010-2011<br />
2011-2012<br />
(to date)<br />
Students % Students % Students % Students % Students %<br />
English 101 1,476 12.7% 1,559 11.5% 1,481 11.0% 1,802 12.5% 793 11.9%<br />
English 028/060s 2,225 19.2% 2,511 18.5% 2,474 18.4% 2,363 16.4% 955 14.3%<br />
English 026/057 1,881 16.2% 2,283 16.8% 2,312 17.2% 2,342 16.3% 924 13.8%<br />
English 021 1,706 14.7% 2,078 15.3% 2,160 16.0% 2,311 16.0% 1,131 16.9%<br />
Reading 020 1,290 11.1% 1,632 12.0% 1,727 12.8% 2,276 15.8% 1,296 19.4%<br />
Referral 439 3.8% 432 3.2% 437 3.2% 286 2.0% 52 0.8%<br />
English 086/<br />
ESL 006A<br />
425 3.7% 580 4.3% 545 4.0% 311 2.2% 108 1.6%<br />
English 085/ ESL<br />
005A<br />
323 2.8% 366 2.7% 390 2.9% 291 2.0% 185 2.8%<br />
English 084/ ESL<br />
004A<br />
286 2.5% 347 2.6% 283 2.1% 348 2.4% 207 3.1%<br />
English 082/ ESL<br />
003A<br />
285 2.5% 302 2.2% 257 1.9% 448 3.1% 205 3.1%<br />
ESL 41CE 211 1.8% 280 2.1% 228 1.7% 321 2.2% 161 2.4%<br />
ESL 40CE 124 1.1% 215 1.6% 176 1.3% 290 2.0% 108 1.6%<br />
No Placement 5 0.0% 8 0.1% 9 0.1% 2 0.0% 2 0.0%<br />
Not Assessed 904 7.8% 966 7.1% 991 7.4% 1,012 7.0% 552 8.3%<br />
Total 11,580 100.0% 13,559 100.0% 13,470 100.0% 14,403 100.0% 6,679 100.0%<br />
10 Page <strong>Educational</strong> <strong>Master</strong> <strong>Plan</strong> 2012
Placement Trends: Math<br />
Math Placement<br />
2007-2008 2008-2009 2009-2010 2010-2011 2011-2012 (to date)<br />
Students % Students % Students % Students % Students %<br />
Math 261 281 2.4% 304 2.2% 346 2.6% 256 1.8% 59 0.9%<br />
TransfLevel2 0.0% 0.0% 0.0% 170 1.2% 108 1.6%<br />
TransfLevel1 0.0% 0.0% 0.0% 572 4.0% 321 4.8%<br />
Transf Level 235 2.0% 228 1.7% 282 2.1% 108 0.7% 0.0%<br />
Math 125/120 1,168 10.1% 1,283 9.5% 1,352 10.0% 1,901 13.2% 1,061 15.9%<br />
Math 115 1,779 15.4% 2,161 15.9% 2,219 16.5% 2,005 13.9% 847 12.7%<br />
Math 112/110 3,023 26.1% 6,032 44.5% 6,295 46.7% 5,642 39.2% 2,037 30.5%<br />
Math 105 1,891 16.3% 532 3.9% 572 4.2% 2,090 14.5% 1,632 24.4%<br />
Referral 1,236 10.7% 1,346 9.9% 1,260 9.4% 568 3.9% 0 0.0%<br />
No Placement 19 0.2% 23 0.2% 44 0.3% 19 0.1% 0.0%<br />
Not Assessed 1,948 16.8% 1,650 12.2% 1,100 8.2% 1,072 7.4% 614 9.2%<br />
Total 11,580 100.0% 13,559 100.0% 13,470 100.0% 14,403 100.0% 6,679 100.0%<br />
While the testing procedures have resulted in more appropriate placement of students and enhanced<br />
access to the placement process. The committee was concerned about the ability of new students to enroll<br />
in the placed course. Given the rate at which math and English classes fill, there was a need to determine<br />
whether students are able to enroll in the class that they are placed into. In Fall 2011, only 18% of<br />
assessed students were able to get into math courses and 14% in English courses that they were placed<br />
into. There is further evidence of this problem in Fall 2012. By the time new students were able to enroll<br />
in classes, 89% of math and English classes were full. In addition, Math 105, Math 110, Math 125, Math<br />
227, English 26, English 101, English 102 and English 103 were all closed.<br />
Placement Enrollment Pattern: Math<br />
Math Course<br />
Number Placed in Number Enrolled in % Enrolled in Placed<br />
Course<br />
Course<br />
Course<br />
Math 105 1,018 62 6%<br />
Math 110 1,312 150 11%<br />
Math 115 563 134 24%<br />
Math 125/120 713 192 27%<br />
Math 261 48 39 81%<br />
TransfLevel1 212 86 41%<br />
TransfLevel2 78 45 58%<br />
Total 3,944 708 18%<br />
11 Page <strong>Educational</strong> <strong>Master</strong> <strong>Plan</strong> 2012
Placement Enrollment Pattern: English<br />
English Course<br />
Number Placed in Number Enrolled in % Enrolled in Placed<br />
Course Course (First Semester)<br />
Course<br />
ENGLISH 021 725 82 11%<br />
ENGLISH 026 597 93 16%<br />
ENGLISH 028 624 130 21%<br />
ENGLISH 101 509 82 16%<br />
READING 020 857 74 9%<br />
ENL Referral 2 -- --<br />
ESL Referral 25 -- --<br />
Total 3,339 461 14% 1<br />
Table 1: Fall 2011 Placement and Fall 2011 Enrollments<br />
1 This percentage excludes ENL and ESL Referrals from the denominator<br />
For Sequential Courses, How Does the Grade in the Previous Class Affect<br />
Success in Next Class?<br />
An analysis of the math and English sequences was conducted to determine the impact of previous grades<br />
on the next course in the sequence. The data clearly demonstrate that the higher the previous grade, the<br />
more likely the student was to be successful in subsequent courses.<br />
English Course Sequence Analysis<br />
Fall 2010 English Course/Grade<br />
Next English Sequence Course<br />
N Retention Success<br />
READING020<br />
P 118 91.5% 75.4%<br />
ENGLISH021<br />
P 207 93.2% 74.9%<br />
ENGLISH026<br />
A 62 95.2% 88.7%<br />
B 191 92.1% 81.7%<br />
C 163 86.5% 66.3%<br />
ENGLISH028<br />
A 113 92.9% 83.2%<br />
B 204 92.2% 76.5%<br />
C 238 86.6% 68.5%<br />
Total 1,296 90.7% 75.3%<br />
12 Page <strong>Educational</strong> <strong>Master</strong> <strong>Plan</strong> 2012
Math Course Sequence Analysis<br />
Fall 2010 Math Course/Grade<br />
Next Math Sequence Course<br />
N Retention Success<br />
MATH105<br />
P 58 87.9% 69.0%<br />
MATH110<br />
P 446 79.8% 49.3%<br />
MATH115<br />
A 165 93.9% 83.6%<br />
B 139 83.5% 60.4%<br />
C 260 75.8% 41.2%<br />
Total 1,068 81.9% 55.1%<br />
Further analysis was conducted to determine how students progress through the sequence across<br />
semesters. General statistics indicate that only 38% of students attempting an English class are able to<br />
progress through that course and pass the subsequent course within two semesters. The results indicate<br />
that only 17% are able to do so in math.<br />
English Progression Analysis<br />
Fall 2010<br />
Fall 2010 English Course<br />
Next English Sequence Course<br />
English Course Attempted Retained Successful Attempted Retained Successful<br />
Reading 020 353 324 226 118 108 89<br />
English 021 613 547 390 207 193 155<br />
English 026 875 742 568 416 376 569<br />
English 028 1,344 1,176 866 555 499 413<br />
Total 3,185 2,789 2,050 1,296 1,176 1,226<br />
Math Progression Analysis<br />
Fall 2010<br />
Fall 2010 Math Course<br />
Next Math Sequence Course<br />
Math Course Attempted Retained Successful Attempted Retained Successful<br />
Math 105 336 269 140 58 51 40<br />
Math 110 1,260 1,026 581 446 356 220<br />
Math 115 1,790 1,398 892 564 468 329<br />
Total 3,386 2,703 1,613 1,068 875 589<br />
Following these results, additional analysis was conducted on specific courses. The focus of this analysis<br />
was on those courses which have been identified as targets for the Achieving the Dream initiative<br />
(English 28 and Math 115). The following data represents the success rates for those classes based on the<br />
student grade in the prerequisite course.<br />
Overall, both success and retention rates in Math 125 showed a positive approximately linear relationship<br />
to grades in Math 115 (e.g. students who received an A in Math 115 had a higher success rate in Math<br />
125 than students who received a B in Math 115). C students in 115 were successful at a rate of only<br />
13 Page <strong>Educational</strong> <strong>Master</strong> <strong>Plan</strong> 2012
36%. There appears to be no difference in the rate at which students delay taking the next course in the<br />
sequence based on their previous grade. Although there have been suggestions that students delay taking<br />
courses in their sequence, it appears that a large majority of students are entering directly into the next<br />
course in the sequence without delay. The data suggests that delaying taking the next course in the<br />
sequence lowers the success rate in the next course dramatically. This impact occurs regardless of the<br />
grade in the previous course.<br />
Grade in<br />
Math 115<br />
Took Math 125 Next<br />
Semester (N = 1554)<br />
Subsequent Success by Grade: Math 115<br />
Took Math 125 Two<br />
Semesters Later (N = 223)<br />
Took Math 125 Three or<br />
Four Semesters Later<br />
(N = 66)<br />
Retention Success Retention Success Retention Success<br />
A 92.9% 82.8% 85.1% 63.8% 77.8% 55.6%<br />
B 79.6% 53.9% 80.0% 35.7% 57.9% 26.3%<br />
C 72.8% 38.4% 64.2% 26.4% 65.5% 13.8%<br />
Total 80.1% 54.6% 73.5% 37.2% 66.7% 28.8%<br />
The majority of students who passed English 26/57 attempted English 28 in the next semester (79.5%).<br />
Students who received an A in English 26/57 were slightly more likely to take English 28 the next<br />
semester compared to students who received a B or C in English 26/57. Very few students waited three or<br />
four semesters to attempt English 28. Overall, both success and retention rates in English 28 showed a<br />
positive approximately linear relationship to grades in English 26/57 (e.g., students who received an A in<br />
English 26/57 had a higher success rate in English 28 than students who received a B in English 26/57).<br />
Also, students who waited two or more semesters to attempt English 28 had lower success and retention<br />
rates than those who took English 28 the next semester. This effect was most evident in students who<br />
received a B or a C in English 26/57. There is a somewhat strange pattern for students who got an A in<br />
English 26/57 and waited two or more semesters to take English 28. Their English 28 success rates were<br />
86.5%, 75%, and 90%, if they took English 28 the next semester, two semesters later, or three to four<br />
semesters later, respectively. This may be due to two reasons. First, there was a smaller sample size of<br />
students who received an A in English 26/57 compared to those who received a B or C. Second, the vast<br />
majority of students who got A’s in English 26/57 took English 28 the next semester. So, the number of A<br />
students who waited two or more semesters to take English 28 may have been too small to accurately<br />
measure retention and success rates.<br />
English 26/57<br />
Grade<br />
Subsequent Success by Grade: English 26/57<br />
Took English 28 Next<br />
Took English 28<br />
Semester Two Semesters Later<br />
(N = 952)<br />
(N = 171)<br />
Took English 28 Three or<br />
Four Semesters Later<br />
(N = 74)<br />
Retention Success Retention Success Retention Success<br />
A 94.5% 86.5% 87.5% 75.0% 90.0% 90.0%<br />
B 89.8% 74.0% 88.6% 68.6% 87.1% 51.6%<br />
C 82.5% 61.1% 79.2% 58.4% 75.8% 57.6%<br />
Total 87.4% 70.5% 84.2% 64.9% 82.4% 59.5%<br />
14 Page <strong>Educational</strong> <strong>Master</strong> <strong>Plan</strong> 2012
What is the Success of Acceleration Models and Compression Models in Math<br />
and English Sequences?<br />
The committee reviewed all relevant literature and data available on alternative models through the 3CSN<br />
network. The overall findings supported the need to create accelerated or compressed models for both<br />
math and English sequences. The college currently has programs in place to pilot both the acceleration<br />
and compression models. In addition, representatives of the Math and English Departments attended the<br />
Achieving the Dream strategies institute to determine successful models that could be implemented at<br />
<strong>ELAC</strong>. The lessons learned from this process have been integrated into the <strong>Educational</strong> <strong>Master</strong> <strong>Plan</strong> and<br />
labeled as ATD strategies. These include the use of common finals, acceleration and compression models,<br />
and possible curricular revisions.<br />
The English Department has piloted an acceleration model that attempts to use web-assisted teaching<br />
methods to move English 26 students to English 101 in one semester of instruction. There is an<br />
assessment plan in place which will garner an evaluation report in Fall 2012. This report will be made<br />
available to the committee at that time to guide in implementation of the new <strong>Educational</strong> <strong>Master</strong> <strong>Plan</strong>.<br />
The Math Department is attempting to compress their sequence with a pilot conducted in Spring 2012.<br />
The data evaluating this pilot will not be complete until the success rates of the subsequent math course<br />
are available. However, initial results are promising. Of the seventy-two students who entered the Math<br />
115 compression model, thirty-three were able to successfully complete two math courses (Math 115 and<br />
Math 125) in one semester. This means that 45.8% of students entering the course were able to pass both<br />
courses in one semester. As a broad comparison, only 18.4% of students enrolled in standard Math 115<br />
courses were able to complete 115 and 125 within two semesters. Success rates were 56.9% in the Math<br />
115 and 84.6% in Math 125. Both of these success rates are substantially higher than the general rates for<br />
these courses. These promising figures are being evaluated by the Math Department in order to continue<br />
their efforts in programmatic improvement.<br />
What is the Success of Specialty Programs (Adelante, Puente, etc…)?<br />
Adelante Data<br />
The Adelante program is a first-year cohort program that is committed to the educational success of<br />
students. Adelante is a comprehensive program involving student services, linked courses, a stimulating<br />
learning environment, and committed faculty which together will provide all Adelante first-year students<br />
with the very best opportunities to succeed in transferring to a four-year university. Data on the Adelante<br />
program shows improved success in the first year, enhanced persistence and increased completion rates.<br />
Success following the first-year experience in Adelante program falls to the college average. The<br />
following table shows success rates for Adelante students in Adelante courses and in standard courses.<br />
15 Page <strong>Educational</strong> <strong>Master</strong> <strong>Plan</strong> 2012
Adelante Success Rates by Ethnicity<br />
2007-2008 2008-2009<br />
Ethnicity<br />
Adelante<br />
Courses<br />
Non-Adelante<br />
Courses<br />
Adelante<br />
Courses<br />
Non-Adelante<br />
Courses<br />
American Indian, Alaskan Native 0.0% 50.0%<br />
Asian/Pacific Islander 45.5% 50.0% 40.0% 66.7%<br />
Black, African-American 33.3% 0.0%<br />
Caucasian, White 50.0% 83.3%<br />
Hispanic/Latino 73.1% 61.9% 66.0% 60.0%<br />
Unknown 33.3% 12.5% 0.0% 50.0%<br />
Total 71.7% 60.9% 65.4% 60.0%<br />
In the following table, a student was included in the cohort if he/she took at least one Adelante course in<br />
that fall term. The persistence data are based on graded enrollment in the subsequent spring and fall<br />
terms (unless otherwise noted).The data indicate substantial increases persistence compared to the general<br />
student body.<br />
Adelante Persistence<br />
Cohort<br />
Cohort Fall-to-Spring Persistence Fall-to-Fall Persistence<br />
N N % N %<br />
Fall 2007 161 143 88.8% 118 73.3%<br />
Fall 2008 187 164 87.7% 135 72.2%<br />
Fall 2009 160 140 87.5% 129 80.6%<br />
Fall 2010 159 143* 90.0%* 128** 80.5%**<br />
Overall 667 590 88.5% 510 76.5%<br />
*Data based on enrollments as of the census date for Spring 2011<br />
**Data based on non-dropped enrollments for Fall 2011<br />
The data also indicate that Adelante students progress through academic milestones with greater success<br />
than the general student body.<br />
16 Page <strong>Educational</strong> <strong>Master</strong> <strong>Plan</strong> 2012
Adelante Cohort Analysis<br />
90.0%<br />
80.0%<br />
70.0%<br />
60.0%<br />
50.0%<br />
40.0%<br />
30.0%<br />
20.0%<br />
10.0%<br />
0.0%<br />
89.4%<br />
62.0%<br />
Fall to Spring<br />
Persistence<br />
73.9%<br />
Fall to Fall<br />
Persistence<br />
52.3%<br />
34.5%<br />
Completion of<br />
of Math and<br />
English<br />
14.3%<br />
15.5%<br />
10.9%<br />
Any<br />
completion<br />
10.6%<br />
Transfer<br />
6.2%<br />
Adelante<br />
General student body<br />
Athletics Data<br />
The college offers thirteen sports. A unique characteristic of the college athlete is that these students are<br />
required to maintain fulltime student status in-season and have minimum GPA requirements. In addition,<br />
the restrictions on the number of years that an athlete can compete, forces an acceleration of the academic<br />
program, if that student wishes to compete at the university level. Lastly, each team has specific<br />
regulations and programs to assist students in their scholastic efforts. The data indicate that student<br />
athletes have increased success rates throughout the educational milestones.<br />
<strong>ELAC</strong> Athletics by Sport<br />
Sport<br />
Students<br />
Badminton 7<br />
Baseball 19<br />
Basketball 18<br />
Cheer 9<br />
Cross Country 9<br />
Football 42<br />
Soccer 25<br />
Softball 12<br />
Track and Field 8<br />
Volleyball 5<br />
Wrestling 10<br />
Total Athletes 164<br />
General Student Body 3,565<br />
Total 3,729<br />
17 Page <strong>Educational</strong> <strong>Master</strong> <strong>Plan</strong> 2012
Cohort Analysis: Athletics<br />
100.0%<br />
90.0%<br />
80.0%<br />
70.0%<br />
60.0%<br />
50.0%<br />
40.0%<br />
30.0%<br />
20.0%<br />
10.0%<br />
0.0%<br />
100.0%<br />
100.0%<br />
72.6%<br />
62.6%<br />
61.6%<br />
52.7%<br />
22.6%<br />
17.7%<br />
10.6%<br />
5.8%<br />
Athletes<br />
General Students<br />
Honors Data<br />
The college has a comprehensive Honors Program. The program guarantees priority consideration for<br />
admission to UCLA, UC Riverside, UC Santa Cruz, UC Irvine, Occidental <strong>College</strong>, Pitzer <strong>College</strong>,<br />
Pomona <strong>College</strong>, Chapman University, Whitman <strong>College</strong>, Loyola Marymount University and Mills<br />
<strong>College</strong>. The program offers academically enriched classes, stressing critical thinking and written<br />
expression. The courses offered include increased student-instructor interaction, and more frequent<br />
association with other academically motivated, transfer-oriented students. Students entering the program<br />
must have a cumulative “B” average (3.0 GPA), eligibility for or completion of English 101, and<br />
completion of twelve transferable units or a cumulative “B” average (3.0 GPA) in high school and<br />
eligibility for English 101. All students from the 2007 cohort were included in the analysis. Any student<br />
successfully completing any honors course was included in the honors group. The results indicate<br />
significant increases in student success throughout the educational milestones.<br />
18 Page <strong>Educational</strong> <strong>Master</strong> <strong>Plan</strong> 2012
100.0%<br />
90.0%<br />
80.0%<br />
70.0%<br />
60.0%<br />
50.0%<br />
40.0%<br />
30.0%<br />
20.0%<br />
10.0%<br />
0.0%<br />
100.0%<br />
Fall to<br />
Spring<br />
Persistence<br />
62.4%<br />
95.5%<br />
Fall to Fall<br />
Persistence<br />
52.3%<br />
Cohort Analysis: Honors<br />
85.1%<br />
13.8%<br />
Completed<br />
English and<br />
Math<br />
Competency<br />
59.7%<br />
Any<br />
Completion<br />
10.2%<br />
38.8%<br />
Transfer<br />
5.7%<br />
Honors<br />
General Student Body<br />
Puente Data<br />
The mission of the Puente Project is to increase the number of educationally underserved students who<br />
enroll in four year colleges and universities, earn degrees, and return to the community as leaders and<br />
mentors to future generations. Puente is open to all interested students. The program utilizes English<br />
instruction, counseling and mentoring to assist students in their educational pursuits. Puente students take<br />
two consecutive writing classes, English 28 (Fall) and English 101 (Spring). These classes provide a<br />
supportive and stimulating environment for Puente students with an emphasis on developing writing skills<br />
through an exploration of the Mexican American/Latino experience. Below are the Puente in course<br />
success rates and program completions.<br />
Puente Success Rates<br />
Graded<br />
Retention<br />
Retained Successful<br />
Enrollment<br />
Rate<br />
Success Rate<br />
English 065 116 106 70 91.4% 60.3%<br />
English 101 88 72 45 81.8% 51.1%<br />
19 Page <strong>Educational</strong> <strong>Master</strong> <strong>Plan</strong> 2012
Cohort Analysis: Puente<br />
80.0%<br />
80.0%<br />
71.4%<br />
70.0%<br />
62.9%<br />
60.0%<br />
52.9%<br />
50.0%<br />
40.0%<br />
30.0%<br />
20.0%<br />
10.0%<br />
31.4%<br />
14.9%<br />
14.3%<br />
11.1%<br />
11.4%<br />
6.3%<br />
Puente<br />
General Student Body<br />
0.0%<br />
Fall to<br />
Spring<br />
Persistence<br />
Fall to Fall<br />
Persistence<br />
Completed<br />
English and<br />
Math<br />
Competency<br />
Any<br />
Completion<br />
Transfer<br />
The data indicate that all of the college’s special programs have greater completion rates than the general<br />
student body. However, the success of students who were fulltime in their first year surpasses the<br />
completion rate for many of these special programs. These findings clearly place an emphasis on<br />
strategies that allow students to maintain a fulltime status.<br />
Fall 2007 Cohort<br />
Cohort Analysis: Special Programs<br />
Fulltime<br />
<strong>College</strong><br />
Adelante Athletes Honors Puente<br />
First Year<br />
N Rate N Rate N Rate N Rate N Rate N Rate<br />
Students 3,729 861 142 164 67 35<br />
Fall to Fall<br />
1,980 53.1%<br />
45.1% 105 73.9% 101 61.6% 64 95.5% 25 71.4%<br />
Persistence<br />
388<br />
Any completion 414 11.1% 244 28.3% 22 15.5% 37 22.6% 40 59.7% 5 14.3%<br />
Transfer 236 6.3% 150 17.4% 15 10.6% 29 17.7% 26 38.8% 4 11.4%<br />
How Successful are Students Who Pass English 101 in All Other Areas?<br />
The data indicate that completion of English 101 significantly improves a student’s ability to complete<br />
other courses. The success rate in non-English courses for those passing English 101 is 75.6%, nearly ten<br />
points higher than the college average. In addition, an analysis of co-enrollment indicates that success in<br />
many of the courses is greatly affected by English levels.<br />
20 Page <strong>Educational</strong> <strong>Master</strong> <strong>Plan</strong> 2012
Success Rates by English Enrollment<br />
English Courses<br />
ESL/English<br />
80's<br />
Reading 20 English 21 English 26 English 28 English 101<br />
CO SCI201 0.82 (n = 28) 0.47 (n = 17) 0.68 (n = 25) 0.71 (n = 17) 0.77 (n = 26) 0.56 (n = 9)<br />
CO SCI291 0.75 (n = 28) 0.65 (n = 17) 0.80 (n = 20) 0.87 (n = 15) 0.62 (n = 26) 0.56 (n = 9)<br />
HEALTH008 0.67 (n = 3) 0.42 (n = 31) 0.49 (n = 59) 0.67 (n = 45) 0.61 (n = 44) 0.67 (n = 12)<br />
HEALTH011 0.82 (n = 22) 0.58 (n = 58) 0.59 (n = 87) 0.72 (n = 54) 0.66 (n = 74) 0.86 (n = 22)<br />
MATH110 0.39 (n = 33) 0.41 (n=125) 0.42 (n=125) 0.58 (n=120) 0.56 (n = 84) 0.50 (n = 12)<br />
MATH115 0.83 (n = 24) 0.62 (n = 13) 0.46 (n = 48) 0.55 (n = 58) 0.63 (n = 96) 0.67 (n = 49)<br />
MATH125 0.77 (n = 39) 0.55 (n = 11) 0.70 (n = 27) 0.55 (n = 20) 0.60 (n = 50) 0.72 (n = 39)<br />
PERSDEV001 1.00 (n = 1) 0.64 (n = 45) 0.88 (n = 26) 0.90 (n = 30) 0.98 (n = 61) 0.73 (n = 11)<br />
PHYS ED726 0.89 (n = 9) 0.69 (n = 35) 0.70 (n = 10) 0.64 (n = 11) 1.00 (n = 10) -<br />
POL SCI001 0.63 (n = 8) 0.31 (n = 26) 0.43 (n = 60) 0.52 (n = 62) 0.57 (n = 77) 0.77 (n = 47)<br />
PSYCH001 0.57 (n = 7) 0.57 (n = 23) 0.57 (n = 49) 0.59 (n = 44) 0.78 (n = 80) 0.76 (n = 38)<br />
SPEECH101 - 0.28 (n = 40) 0.62 (n = 45) 0.58 (n = 53) 0.61 (n = 76) 0.74 (n = 50)<br />
SPEECH113 0.87 (n = 31) 1.00 (n = 2) 1.00 (n = 5) 1.00 (n = 1) - 1.00 (n = 1)<br />
Are Teachers Using Effective Practices/Pedagogy?<br />
The committee recognized the intricacies of effective teaching and the different strategies used across<br />
disciplines. Given the differences in curriculum, student success is a poor indicator of comparative<br />
efficacy. To address this concern, the following plan has been approved by the Academic Senate. The<br />
Office of Institutional Effectiveness is already working with USC to develop a research relationship.<br />
Pedagogy Evaluation<br />
One of <strong>ELAC</strong>’s core goals is to increase student success and academic excellence through studentcentered<br />
instruction, student-centered support services, and dynamic technologies. Intrinsic in this goal is<br />
the need to utilize effective and promising pedagogy that target the needs of the underrepresented students<br />
that <strong>ELAC</strong> serves. While the college has made many efforts to increase the use of effective pedagogy, it<br />
has never established a systematic way of assessing the use and efficacy of these effective pedagogical<br />
strategies.<br />
The college recognizes that the faculty collectively represents a great source of practical and technical<br />
expertise. However, the current trends in effective teaching techniques and learning theories often require<br />
experts in the field of education. To this end the college will seek a partnership with universities with the<br />
expressed purpose of developing a method for assessing effective pedagogy and linking this to success<br />
with underrepresented student populations.<br />
Suggested Methodology<br />
The <strong>College</strong> will seek a group of university doctoral candidates who wish to investigate the impact of<br />
effective pedagogy on minority success rates. These students will bring with them an expertise in teaching<br />
and learning theories and practices. Through their literature review, they will be able to inform the college<br />
of the hallmarks of effective pedagogy. This group will meet with the academic senate and utilize the<br />
21 Page <strong>Educational</strong> <strong>Master</strong> <strong>Plan</strong> 2012
practical experience of the faculty to develop a rubric for assessing, through observation, the presence of<br />
different effective pedagogical techniques.<br />
The Academic Senate and the students will solicit faculty volunteers for observation. The students will<br />
observe class sessions and complete evaluations of the techniques used. These evaluations will be shared<br />
with the faculty member being observed, but be blinded in other analysis. The data will be linked to<br />
student success in those classes and be compared with the general success rate for similar courses.<br />
Through this method, the college will be able to determine the use and effectiveness of different<br />
techniques.<br />
What Courses Do New Students Taken in Their First Year?<br />
The most frequently taken courses in Fall 2008 for first-time students are presented in the following table.<br />
In general, the courses represent general education requirements or electives for degree or transfer<br />
programs. In addition, the students attempt to complete courses in the math and English sequences. The<br />
data indicate a large range of success rates with some courses as low as 45.7% and as high as 86.8%.<br />
First Semester Enrollment for New Students<br />
Course Enrollments Success Rate<br />
MATH110 698 45.7%<br />
MATH115 464 63.4%<br />
HEALTH011 439 70.8%<br />
POL SCI001 381 53.0%<br />
PSYCH001 351 64.1%<br />
ENGLISH021 342 62.9%<br />
ENGLISH057 324 60.8%<br />
MATH125 266 77.1%<br />
PERSDEV001 255 82.0%<br />
ENGLISH065 255 59.2%<br />
CH DEV001 243 67.5%<br />
SPEECH101 212 48.1%<br />
HEALTH008 206 54.9%<br />
ENGLISH101 194 52.1%<br />
SOC001 182 51.1%<br />
READING020 160 64.4%<br />
PHYS ED690 136 64.7%<br />
HISTORY011 127 61.4%<br />
CO SCI291 125 55.2%<br />
CO SCI201 121 53.7%<br />
CHICANO007 119 62.2%<br />
ENGLISH086 114 86.8%<br />
22 Page <strong>Educational</strong> <strong>Master</strong> <strong>Plan</strong> 2012
What Do Enrollment Date (Fill Rate, Time of Day, Location) Say About Student<br />
Need?<br />
The committee indicated a concern that students have difficulty completing bottleneck courses, especially<br />
in the math and English sequence. The Office of Institutional Effectiveness ran an analysis to determine<br />
what would be required should every new student progress through the sequence without skipping a<br />
semester. Given the current success rates and placements, the required offerings are well beyond the<br />
college’s ability to offer. As an example, more than 3,000 seats would be required in English 101 and<br />
only 1,600 are currently offered.<br />
Projected English Demand<br />
Success Rate<br />
64% 63% 65% 64% 65%<br />
Reading 020 English 021 English 026 English 028 English 101<br />
Students from Placement 859 761 603 636 515<br />
Students Repeating 309 551 775 918 966<br />
Students Progressing<br />
from Previous Course<br />
0 748 1,595 1,925 2,232<br />
Total Space Needed 1,168 2,060 2,973 3,480 3,713<br />
Success Rate<br />
Projected Math Demand<br />
41% 46% 50% 47% 55%<br />
Math 105 Math 110 Math 115 Math 125<br />
"Transfer<br />
Level"<br />
Students from Placement 1,061 1,334 574 714 212<br />
Students Repeating 625 1,092 1,010 1,327 906<br />
Students Progressing<br />
from Previous Course<br />
0 693 1,438 1,793 1,804<br />
Total Space Needed 1,686 3,119 3,022 3,834 2,921<br />
23 Page <strong>Educational</strong> <strong>Master</strong> <strong>Plan</strong> 2012
Current English and Math Capacity<br />
Fall 2010 Spring 2011 Fall 2011<br />
Course<br />
Sections<br />
Enrollment<br />
Enrollment<br />
Enrollment<br />
Sections<br />
Sections<br />
Capacity<br />
Capacity<br />
Capacity<br />
READING020 10 405 8 308 10 405<br />
ENGLISH021 16 720 17 760 16 720<br />
ENGLISH026 23 945 26 1,170 23 990<br />
ENGLISH028 33 1,395 34 1,485 32 1,305<br />
ENGLISH101 41 1,745 47 1,928 38 1,610<br />
ENGLISH102 7 270 7 315 7 270<br />
ENGLISH103 28 1,215 31 1,295 27 1,170<br />
MATH105 9 355 11 495 6 270<br />
MATH110 23 990 26 1,112 19 810<br />
MATH112 1 40 1 40 1 40<br />
MATH115 38 1,565 38 1,630 35 1,470<br />
MATH120 5 225 4 180 5 180<br />
MATH125 35 1,450 36 1,537 33 1,400<br />
MATH215 2 90 2 90 2 90<br />
MATH216 1 45 1 45 1 45<br />
MATH227 27 1,150 26 1,026 27 1,130<br />
MATH230 2 85 2 85 2 85<br />
MATH235 1 45 1 45 1 45<br />
MATH236 1 45 1 45 1 45<br />
MATH241 4 180 6 270 5 225<br />
MATH245 6 265 11 490 5 220<br />
MATH260 9 400 9 400 11 490<br />
Additional analysis was conducted on all courses. The results indicate that a majority of seats are filled<br />
more than a month prior to the start of classes. In addition, the data indicate that online and South Gate<br />
courses fill at a greater rate than the college average. Whereas time of day has had a major impact on fill<br />
rates in the past, all courses appear to be filling across the board. These data have also been given to the<br />
Enrollment Management Committee for use in their efforts at prioritization efforts.<br />
<strong>College</strong> Enrollment Trends<br />
Relative Day Fall 2010 Spring 2011 Fall 2011<br />
-60 24,711 29,337 16,858<br />
-30 14,142 17,401 11,473<br />
-15 11,745 13,726 9,359<br />
-7 10,524 12,714 9,167<br />
0 10,484 12,596 8,201<br />
24 Page <strong>Educational</strong> <strong>Master</strong> <strong>Plan</strong> 2012
35,000<br />
<strong>College</strong> Enrollment Trends<br />
30,000<br />
25,000<br />
20,000<br />
15,000<br />
10,000<br />
Fall 2010<br />
Spring 2011<br />
Fall 2011<br />
5,000<br />
-<br />
-60 -30 -15 -7 0<br />
<strong>College</strong> Enrollment Trends Fill Rate by Location<br />
Relative Day Main Campus Off-Site Online Rosemead South Gate<br />
-60 75.6% 27.3% 85.5% 77.8% 91.7%<br />
-30 83.1% 34.8% 91.4% 85.5% 97.4%<br />
-15 86.2% 53.3% 92.7% 88.6% 98.8%<br />
-7 86.8% 53.6% 93.1% 88.4% 98.4%<br />
0 88.4% 56.7% 93.4% 81.8% 98.2%<br />
100.0%<br />
90.0%<br />
80.0%<br />
70.0%<br />
60.0%<br />
50.0%<br />
40.0%<br />
30.0%<br />
20.0%<br />
<strong>College</strong> Enrollment Trends<br />
Fill Rate by Location<br />
-60 -30 -15 -7 0<br />
Main Campus<br />
Off-Site<br />
Online<br />
Rosemead<br />
South Gate<br />
25 Page <strong>Educational</strong> <strong>Master</strong> <strong>Plan</strong> 2012
Fill Rate by Relative Time of Day<br />
Relative<br />
Day<br />
6AM-8AM<br />
Start<br />
8AM-10AM<br />
Start<br />
10AM-Noon<br />
Start<br />
Noon-2PM<br />
Start<br />
2PM-4PM<br />
Start<br />
4PM-6PM<br />
Start<br />
6PM or<br />
Later Start<br />
-60 81.0% 88.6% 88.0% 89.4% 82.1% 81.0% 82.2%<br />
-30 88.3% 94.4% 94.3% 97.3% 89.9% 88.3% 92.0%<br />
-15 92.1% 95.9% 97.0% 99.6% 92.1% 92.1% 95.0%<br />
-7 92.7% 95.8% 97.3% 99.4% 90.3% 92.7% 95.2%<br />
0 95.5% 96.9% 98.0% 102.0% 91.1% 95.5% 93.2%<br />
Course Availability by Time of Day<br />
Time of Day<br />
Fall 2010 Spring 2011 Fall 2011<br />
Sections Sec Limit Sections Sec Limit Sections Sec Limit<br />
10AM-Noon Start 210 8,043 205 8,079 207 7,965<br />
2PM-4PM Start 135 5,516 172 6,112 144 5,789<br />
4PM-6PM Start 105 3,514 114 4,151 104 3,617<br />
6AM-8AM Start 152 4,917 170 5,395 163 5,204<br />
6PM or Later Start 334 13,281 359 14,228 329 13,253<br />
8AM-10AM Start 345 13,524 361 13,786 341 13,648<br />
Noon-2PM Start 253 9,603 271 10,329 271 10,317<br />
TBA 346 18,458 346 20,036 320 17,640<br />
Total 1,880 76,856 1,998 82,116 1,879 77,433<br />
What is the Impact of Counseling on Student Success?<br />
The <strong>Educational</strong> <strong>Plan</strong>ning Subcommittee requested data to determine the impact of receiving counseling<br />
and/or an educational plan on student success. The only available data that could be used in this type of<br />
analysis comes from the Counseling Department’s scheduling system (i.e. SARS). Unfortunately, the data<br />
in this system suffers from a number of flaws, some of which are serious. First, the data simply lists the<br />
appointments that were made. There is no variable in the data system which indicates whether a student<br />
actually showed up for the appointment or not. Next, assuming that a student did go to the Counseling<br />
session, there is no information on what Counseling services the student received at the session (i.e.,<br />
received an educational plan, discussed transfer options, discussed different majors, etc.). There is a code<br />
which indicates the reason a student made the appointment, but there are a few problems with it. First,<br />
there is no indication that a student’s reason for making an appointment was the same as what was<br />
actually discussed at the session. Further, many of the students came in for “general advisement”, which<br />
gives very little usable information.<br />
Looking beyond the SARS system, OIE found out that the Counseling Department does not keep<br />
computerized records of the students that have received an educational plan. Rather, the department only<br />
keeps hard copies of educational plans for three years. Given the length of time it takes many students to<br />
complete their educational goals at <strong>ELAC</strong>, even if the educational plans were entered into a computer<br />
system, we would not have complete data for a large percentage of students.<br />
26 Page <strong>Educational</strong> <strong>Master</strong> <strong>Plan</strong> 2012
How Effective is the Faculty Transfer Advisor?<br />
The Faculty Transfer Advisor program provides workshops to interested faculty on transfer and financial<br />
aid related issues. These faculty work with students to help guide them through the transfer process. In a<br />
detailed evaluation of the Faculty Transfer Advisor program, the committee found that a majority of<br />
faculty were overwhelmingly satisfied with the program. In addition, most faculty reported seeing more<br />
students and having more confidence in the information that they were providing to these students.<br />
Faculty comments included:<br />
The Faculty Transfer Advisor program has been very useful for me. I am much better<br />
equipped to answer students' questions and can serve as a better guide and mentor for<br />
them. Thanks!<br />
More than ever students need role models that know the path that lies ahead of them and<br />
can provide them with a clear vision of what the transfer process entails. As a transfer<br />
student myself, I appreciate the opportunity to provide students with useful and accurate<br />
information in hopes that their transition is not only successful but also invigorating. We<br />
want our transfer students to hit the ground running and not stumble their way through<br />
university life. The Faculty Transfer Advisor Program at <strong>ELAC</strong> promotes contact<br />
between a student in need of advice and an instructor who is well informed in the current<br />
transfer process and experienced in the student's field of interest. The FTAP provides the<br />
training necessary to assure advisors are up to speed on the latest transfer issues and<br />
technologies. I support the program wholeheartedly.<br />
How Does Financial Aid Impact Student Success?<br />
The data indicate that financial aid has a substantial impact on student completion. All forms of aid, with<br />
the exception of the Board of Governors Grant Fee Waiver (BOGG), improve student completion. An<br />
overwhelming number of students qualify for the BOGG, which only waves tuition. It appears that more<br />
substantial aid that can cover other educational costs provide more support for student success than tuition<br />
waivers alone.<br />
Financial Aid<br />
Students<br />
Cohort Analysis by Financial Aid Status<br />
Completed<br />
Completed<br />
First<br />
Completed<br />
Both Math<br />
Semester<br />
60+ Units<br />
and English<br />
Units<br />
Completion<br />
Completion<br />
Rate<br />
BOGG Only 1,391 890 160 174 119 8.6%<br />
Need Based<br />
(Pell, etc.)<br />
766 674 180 193 134 17.5%<br />
No Aid 1,568 972 222 181 160 10.2%<br />
Other Award<br />
or Loan<br />
4 3 1 1 1 25.0%<br />
Total 3,729 2,539 563 549 414 11.10%<br />
27 Page <strong>Educational</strong> <strong>Master</strong> <strong>Plan</strong> 2012
How Does Fulltime Status Impact a Student’s Success Rate?<br />
As indicated previously, maintaining a fulltime status increases a student’s chance of completing a<br />
degree, certificate or transfer program. In addition, fulltime students have greater in-course success than<br />
other students. The success rates below indicate the success of the Fall 2007 cohort students each<br />
semester depending on their enrollment status. If the students maintain fulltime status for two-years, their<br />
completion rate reaches nearly 40%.<br />
Success Rates Fall 2007 Cohort by Enrollment Status<br />
Fall 2007<br />
Status Enrollment Retention Success Success Rate<br />
Fulltime 6,304 5,674 4,196 66.6%<br />
6-11 3,349 2,849 1,722 51.4%<br />
Under 6 942 779 435 46.2%<br />
Spring 2008<br />
Status Enrollment Retention Success Success Rate<br />
Fulltime 5,055 4,483 3,404 67.3%<br />
6-11 2,341 1,929 1,215 51.9%<br />
Under 6 384 333 192 50.0%<br />
Fall 2008<br />
Status Enrollment Retention Success Success Rate<br />
Fulltime 4,283 3,781 2,976 69.5%<br />
6-11 1,889 1,528 984 52.1%<br />
Under 6 346 283 180 52.0%<br />
Spring 2009<br />
Status Enrollment Retention Success Success Rate<br />
Fulltime 3,985 3,494 2,770 69.5%<br />
6-11 1,661 1,309 921 55.5%<br />
Under 6 314 251 159 50.6%<br />
Fall 2009<br />
Status Enrollment Retention Success Success Rate<br />
Fulltime 2,693 2,392 1,870 69.4%<br />
6-11 1,370 1,129 817 59.6%<br />
Less than 6 605 495 331 54.7%<br />
Spring 2010<br />
Status Enrollment Retention Success Success Rate<br />
Fulltime 2,290 1,994 1,631 71.2%<br />
6-11 1,408 1,152 818 58.1%<br />
Under 6 301 223 154 51.2%<br />
28 Page <strong>Educational</strong> <strong>Master</strong> <strong>Plan</strong> 2012
Fulltime First<br />
Two Years<br />
Hall to Fulltime<br />
First Two Years<br />
Students<br />
Cohort Analysis by Enrollment Status<br />
Completed Completed<br />
Completed<br />
First Semester Both Math<br />
60+ Units<br />
Units and English<br />
Completion<br />
Completion<br />
Rate<br />
476 468 299 336 187 39.3%<br />
1,152 1,087 478 505 284 24.7%<br />
Ongoing Data Needs<br />
The committee will continue to gather detailed information through student surveys, focus groups and<br />
additional quantitative analysis. These efforts are part of the committee’s continuous work to improved<br />
educational programs and follow-through on the implementation the <strong>Educational</strong> <strong>Master</strong> <strong>Plan</strong>.<br />
Continuous Data Needs<br />
What data exist to inform curriculum development?<br />
Why are students completing 0 units in first semester?<br />
How well do GE and transfer requirements align?<br />
Why do students fail to get an AA degree?<br />
Lack of accessibility<br />
Lack of knowledge of direction<br />
AA has no value<br />
What data exists to prioritize reductions in a time of economic crisis?<br />
Following the completion of the data review, the EPSC constructed educational planning objectives using<br />
the <strong>College</strong> Mission, Vision, and Strategic Goals as a guide. <strong>Educational</strong> planning objectives are<br />
developed in a manner that meeting these objectives will lead to the fulfillment of the college‘s strategic<br />
directions and values. Each objective has accompanying action items that describe the manner in which<br />
the objective should be accomplished. Specific measurable outcomes are assigned to responsible entities<br />
and collaborators to assist in the implementation process. The completed educational plan is vetted<br />
through the campus community, including the Academic Senate, the Associated Student Union, and the<br />
faculty, staff, and general student body. The goal of the vetting process is to receive input from all<br />
constituent groups in a manner that promotes the development of a revised plan with college-wide<br />
support. Upon completion of the vetting process, the committee meets to finalize the draft to be sent to<br />
ESGC for approval. The ESGC-approved draft is then forwarded to the Board of Trustees for approval.<br />
The following pages provide the <strong>Educational</strong> <strong>Master</strong> <strong>Plan</strong> Objectives, and Action Items. In addition,<br />
alignment to the Strategic <strong>Plan</strong> Goals, underlying data and measurable outcomes are provided in an effort<br />
to provide a concise presentation of the <strong>Educational</strong> <strong>Master</strong> <strong>Plan</strong> from data collection through evaluation.<br />
29 Page <strong>Educational</strong> <strong>Master</strong> <strong>Plan</strong> 2012
EAST LOS ANGELES COLLEGE<br />
EDUCATIONAL MASTER PLAN 2012 – 2018<br />
OBJECTIVES AND ACTION ITEMS<br />
30 Page <strong>Educational</strong> <strong>Master</strong> <strong>Plan</strong> 2012
Goal<br />
Goal 1:<br />
Increasing<br />
student success<br />
and academic<br />
excellence<br />
through studentcentered<br />
instruction,<br />
student-centered<br />
support services,<br />
and dynamic<br />
technologies.<br />
Why Data/Underlying<br />
Factors<br />
32% of students fail to<br />
complete units in their first<br />
semester; lowering completion<br />
rates from 11.1% to 2.6%.<br />
Presentations on successful<br />
strategies and the ATD<br />
strategy institute.<br />
Presentations from cohort<br />
programs at Student Success<br />
Committee.<br />
Increased completion rates for<br />
fulltime students.<br />
Literature on campus<br />
involvement and student<br />
success.<br />
74% of students report<br />
attending no campus activities<br />
outside of class.<br />
Objective Actions Item Evaluation Target<br />
Ensure on-campus student<br />
engagement to increase<br />
academic achievement.<br />
Review and restructure existing<br />
college mentor programs to<br />
serve a greater number of both<br />
high-achieving and struggling<br />
students.<br />
Create strategies to increase the<br />
number of students participating<br />
in new and existing cohort<br />
programs.<br />
Develop enrollment management<br />
strategies to increase students’<br />
ability to be fulltime students.<br />
Promote more work experience<br />
and volunteer opportunities<br />
throughout the campus.<br />
First‐year persistence<br />
Certificate rate<br />
Graduation rate<br />
Transfer rate<br />
Student Right-to-Know (SRTK)<br />
Completion/transfer rates<br />
ARCC student progress and<br />
achievement<br />
First‐year persistence<br />
Certificate rate<br />
Graduation rate<br />
Transfer rate<br />
Student Right-to-Know (SRTK)<br />
Completion/transfer rates<br />
ARCC student progress and<br />
achievement<br />
In‐course retention<br />
In‐course success<br />
First‐year persistence<br />
In‐course retention<br />
In‐course success<br />
First‐year persistence<br />
42% of student report never<br />
attending office hours.<br />
50-100% increase in<br />
completion rates for special<br />
cohort programs such as<br />
Adelante, Puente, Honors and<br />
Athletics.<br />
Extend the college hour to<br />
Monday-Thursday, 12:10-1:30<br />
PM., designated solely for<br />
activities and events to engage<br />
students in college life beyond<br />
the classroom and office hours.<br />
In‐course retention<br />
In‐course success<br />
First‐year persistence<br />
31 Page <strong>Educational</strong> <strong>Master</strong> <strong>Plan</strong> 2012
Goal<br />
Goal 1:<br />
Increasing<br />
student success<br />
and academic<br />
excellence<br />
through studentcentered<br />
instruction,<br />
student-centered<br />
support services,<br />
and dynamic<br />
technologies.<br />
Why Data/Underlying<br />
Factors<br />
Student focus groups report<br />
time management as a barrier<br />
to student success and a need<br />
for mandatory workshops on<br />
how to be a college student.<br />
Literature on the need for<br />
continuous advisement.<br />
20% of students report having<br />
no familiarity with the<br />
counseling office and only<br />
65% report having received<br />
counseling services in the last<br />
year.<br />
32% of students fail to<br />
complete units in their first<br />
semester; lowering completion<br />
rates from 11.1% to 2.6%.<br />
Over half the student body list<br />
uncertainty in personal or<br />
career goals a barrier to<br />
student success.<br />
82% of students report not<br />
having received services from<br />
the Career Center.<br />
Literature on the impact of<br />
college on employability.<br />
Objective Actions Item Evaluation Target<br />
Ensure adequate student<br />
support services through the<br />
development and<br />
implementation of studentcentered<br />
interventions.<br />
Enhance student<br />
employability by expanding<br />
interdisciplinary<br />
opportunities on campus and<br />
strengthening campus career<br />
services.<br />
Maintain appropriate support<br />
services and create an evaluation<br />
plan to assess the effectiveness<br />
and efficiency of current<br />
offerings/availability of student<br />
support services, e.g. tutoring<br />
sessions and workshops; and<br />
implement successful lessons<br />
learned from it.<br />
Assist faculty in being more<br />
proactive in assessing students’<br />
academic performance,<br />
providing them feedback within<br />
the first three weeks of<br />
instruction, and referring<br />
students to appropriate support<br />
services.<br />
Review effectiveness of current<br />
student orientation and expand<br />
its use online and within<br />
classroom sessions.<br />
Recruit industry-based<br />
professionals for advisory<br />
committees.<br />
Uniformly apply best practices<br />
in soliciting input from<br />
businesses to all career-focused<br />
education.<br />
Expand assessment tests on<br />
personal skills, aptitudes, and<br />
interests to a wider range of<br />
students, and integrate results<br />
into student advisement toward<br />
academic preparation and<br />
employment pathways.<br />
First‐year persistence<br />
Certificate rate<br />
Graduation rate<br />
Transfer rate<br />
Student Right-to-Know (SRTK)<br />
Completion/transfer rates<br />
ARCC student progress and<br />
achievement<br />
In‐course retention<br />
In‐course success<br />
In‐course retention<br />
In‐course success<br />
First‐year persistence<br />
Certificate rate<br />
Certificate rate<br />
Certificate rate<br />
32 Page <strong>Educational</strong> <strong>Master</strong> <strong>Plan</strong> 2012
Goal<br />
Why Data/Underlying<br />
Factors<br />
Objective Actions Item Evaluation Target<br />
Goal 1:<br />
Increasing<br />
student success<br />
and academic<br />
excellence<br />
through studentcentered<br />
instruction,<br />
student-centered<br />
support services,<br />
and dynamic<br />
technologies.<br />
Presentations on successful<br />
strategies and the ATD<br />
strategy institute.<br />
50% increase in completion<br />
for current first-year program.<br />
Literature on campus<br />
involvement and student<br />
success.<br />
Student focus groups report<br />
time management as a barrier<br />
to student success and a need<br />
for mandatory workshops on<br />
how to be a college student.<br />
Too few students assess at the<br />
transfer-level:<br />
12% in English<br />
7.5% in Math<br />
Provide a comprehensive<br />
first-year experience that<br />
promotes and enhances<br />
student completion.<br />
Evaluate application deadlines<br />
and create new hard deadlines to<br />
incentivize time-management<br />
and completion of the<br />
matriculation process. {ATD}<br />
Realign student support services<br />
to target first-time college<br />
students (especially during the<br />
first two weeks of instruction.)<br />
Create an integrated pre-college<br />
guidance program that connects<br />
K-12 to First-Year Experience,<br />
including on-campus noncredit<br />
orientation and additional high<br />
school cohorts.<br />
Have students identify their<br />
“programs of study” by the end<br />
of the first year (may include<br />
creating strategies to advertise<br />
majors and immerse students<br />
into career and transfer options.)<br />
Develop a comprehensive<br />
summer bridge program for high<br />
school students that promote oncampus<br />
student services such as<br />
matriculation, financial aid, and<br />
counseling.<br />
In‐course retention<br />
In‐course success<br />
First‐year persistence<br />
Math improvement rate<br />
English improvement rate<br />
ESL improvement rate<br />
In‐course retention<br />
In‐course success<br />
First‐year persistence<br />
In‐course retention<br />
In‐course success<br />
First‐year persistence<br />
Math improvement rate<br />
English improvement rate<br />
ESL improvement rate<br />
In‐course retention<br />
In‐course success<br />
First‐year persistence<br />
Transfer rate<br />
Student Right-to-Know (SRTK)<br />
Completion/transfer rates<br />
ARCC student progress and<br />
achievement<br />
In‐course retention<br />
In‐course success<br />
First‐year persistence<br />
Transfer rate<br />
Student Right-to-Know (SRTK)<br />
Completion/transfer rates<br />
ARCC student progress and<br />
achievement<br />
33 Page <strong>Educational</strong> <strong>Master</strong> <strong>Plan</strong> 2012
Goal<br />
Goal 1:<br />
Increasing<br />
student success<br />
and academic<br />
excellence<br />
through studentcentered<br />
instruction,<br />
student-centered<br />
support services,<br />
and dynamic<br />
technologies.<br />
Why Data/Underlying<br />
Factors<br />
Noted success of the college’s<br />
New Faculty Institute.<br />
Literature on the specific<br />
needs of first-generation<br />
college students.<br />
Noted differences in<br />
preparation in students<br />
entering at each level.<br />
32% of students fail to<br />
complete units in their first<br />
semester; lowering completion<br />
rates from 11.1% to 2.6%.<br />
Noted differences in<br />
preparation in students<br />
entering at each level.<br />
Objective Actions Item Evaluation Target<br />
Provide sustained<br />
professional development<br />
training for faculty<br />
Strengthen college response<br />
to struggling students.<br />
Develop a year-round<br />
professional development<br />
program that provides faculty<br />
with effective instructional<br />
strategies related to the needs of<br />
first-year students.<br />
Develop a comprehensive series<br />
in research-based principles of<br />
instruction.<br />
Integrate successful strategies<br />
identified by course-and<br />
program-level Learning<br />
Outcomes assessments into<br />
professional development<br />
programs.<br />
Identify and promote best<br />
practices in dynamic and<br />
interactive online learning.<br />
Work with faculty in providing<br />
effective and proactive<br />
intervention strategies to assist<br />
those who are struggling earlier<br />
in the semester.<br />
Implement methods to measure<br />
the success of students who were<br />
granted appeals to dismissal or<br />
who were reinstated via petition.<br />
In‐course retention<br />
In‐course success<br />
First‐year persistence<br />
Transfer rate<br />
Student Right to Know (SRTK)<br />
Completion/transfer rates<br />
ARCC student progress and<br />
achievement<br />
In‐course retention<br />
In‐course success<br />
First‐year persistence<br />
Transfer rate<br />
Student Right to Know (SRTK)<br />
Completion/transfer rates<br />
ARCC student progress and<br />
achievement<br />
In‐course retention<br />
In‐course success<br />
In‐course retention<br />
In‐course success<br />
In‐course retention<br />
In‐course success<br />
First‐year persistence<br />
Transfer rate<br />
Completion/transfer rates<br />
ARCC student progress and<br />
achievement<br />
In‐course retention<br />
In‐course success<br />
34 Page <strong>Educational</strong> <strong>Master</strong> <strong>Plan</strong> 2012
Goal<br />
Goal 2:<br />
Increasing equity<br />
in successful<br />
outcomes by<br />
analyzing gaps in<br />
student<br />
achievement and<br />
using this, to<br />
identify and<br />
implement<br />
effective models<br />
and programming<br />
to remedy these<br />
gaps.<br />
Why Data/Underlying<br />
Factors<br />
Too few students test at<br />
Transfer-level:<br />
12% in English<br />
7.5% in Math<br />
Starting lower in the sequence<br />
diminishes chances of<br />
completing the sequence.<br />
(English 101-Reading 20) 73%<br />
sequence completion to 11%.<br />
(Transfer-level to Math 105)<br />
87% sequence completion to<br />
3%.<br />
Pilot data shows that bridge<br />
programs increase math and<br />
English Placement results.<br />
Large range in grading in<br />
sequential courses.<br />
Noted differences in<br />
preparation in students<br />
entering at each level.<br />
Student focus groups report<br />
barriers in skills related to:<br />
Grammar and Spelling<br />
Essay Writing<br />
Reading Comprehension<br />
Noted attrition between math<br />
and English sequences.<br />
Objective Actions Item Evaluation Target<br />
Increase the proportion of<br />
students who progress<br />
through the developmental<br />
math and English sequences.<br />
{ATD}<br />
Utilize noncredit services in<br />
order to increase progress<br />
through the English and Math<br />
course sequences.<br />
Review, implement, and assess<br />
compressed/acceleration and<br />
alternative course models in the<br />
English and math course<br />
sequences, focusing on effective<br />
practices, e.g., increased timeon-task<br />
and tutoring support.<br />
Provide appropriate training and<br />
support implementation of grade<br />
norming.<br />
Develop strategies to encourage<br />
students to earn grades of “As”<br />
or “Bs.”<br />
Monitor students who have<br />
successfully completed a<br />
prerequisite math and English<br />
course—but have still not<br />
enrolled in the next requisite<br />
course the following semester—<br />
and develop methods to increase<br />
availability of courses for these<br />
students, e.g., additional<br />
sections, shadow seats.<br />
Review, implement, and assess<br />
successful student support<br />
models such as specialized<br />
centers, specialized tutoring,<br />
automated diagnostics, and<br />
remediated services.<br />
Hispanic/Latino math<br />
improvement rate<br />
Hispanic/Latino English<br />
improvement rate<br />
Math improvement rate<br />
English improvement rate<br />
ESL improvement rate<br />
Hispanic/Latino certificate rate<br />
Hispanic/Latino graduation rate<br />
Hispanic/Latino transfer rate<br />
Math improvement rate<br />
English improvement rate<br />
ESL improvement rate<br />
Math improvement rate<br />
English improvement rate<br />
ESL improvement rate<br />
Math improvement rate<br />
English improvement rate<br />
ESL improvement rate<br />
Hispanic/Latino English<br />
improvement rate<br />
Hispanic/Latino ESL<br />
improvement rate<br />
35 Page <strong>Educational</strong> <strong>Master</strong> <strong>Plan</strong> 2012
Goal<br />
Goal 2:<br />
Increasing equity<br />
in successful<br />
outcomes by<br />
analyzing gaps in<br />
student<br />
achievement and<br />
using this, to<br />
identify and<br />
implement<br />
effective models<br />
and programming<br />
to remedy these<br />
gaps.<br />
Why Data/Underlying<br />
Factors<br />
A 5% gap in success rates<br />
between Hispanic/Latino<br />
students and the general<br />
college rate.<br />
Over a 20% gap in the transfer<br />
rate between Hispanic/Latino<br />
students and the general<br />
college rate.<br />
Objective Actions Item Evaluation Target<br />
Create strategies to recruit<br />
and support<br />
underrepresented groups and<br />
to eliminate the achievement<br />
gap.<br />
Improve the transfer rate for<br />
underrepresented groups.<br />
Target high-impact courses<br />
disproportionately representing<br />
an ethnic group or gender where<br />
success rates are significantly<br />
lower.<br />
Provide professional<br />
development training to support<br />
faculty in identifying the unique<br />
academic needs of the student<br />
population and addressing<br />
identified equity gaps.<br />
Tailor the presentation of the<br />
university transfer process to<br />
specifically address cultural<br />
concerns of students and their<br />
families.<br />
Hispanic/Latino in-course<br />
retention<br />
Hispanic/Latino in-course<br />
success Hispanic/Latino firstyear<br />
persistence<br />
Hispanic/Latino certificate rate<br />
Hispanic/Latino graduation rate<br />
Hispanic/Latino transfer rate<br />
Hispanic/Latino in-course<br />
retention<br />
Hispanic/Latino in-course<br />
success Hispanic/Latino firstyear<br />
persistence<br />
Hispanic/Latino certificate rate<br />
Hispanic/Latino graduation rate<br />
Hispanic/Latino transfer rate<br />
Hispanic/Latino transfer rate<br />
36 Page <strong>Educational</strong> <strong>Master</strong> <strong>Plan</strong> 2012
Goal<br />
Goal 3:<br />
Sustaining<br />
communitycentered<br />
access,<br />
participation, and<br />
preparation that<br />
improves the<br />
college's presence<br />
in the<br />
community,<br />
maximizes access<br />
to higher<br />
education and<br />
provides outlets<br />
for artistic, civic,<br />
cultural, scientific<br />
and social<br />
expression as<br />
well as<br />
environmental<br />
awareness.<br />
Why Data/Underlying<br />
Factors<br />
Literature on campus<br />
involvement and student<br />
success.<br />
Reduction in available courses<br />
to students.<br />
30% of students indicate that<br />
the college has improved their<br />
availability to contribute to the<br />
welfare of the community very<br />
little.<br />
Starting lower in the sequence<br />
diminishes chances of<br />
completing the sequence.<br />
More than 86% of students test<br />
below transfer level in English<br />
or math.<br />
The college transfer rate is at<br />
14.2% and has been in decline<br />
as traditional transfer partners<br />
have limited admissions.<br />
20% of students report having<br />
no familiarity with Financial<br />
Aid.<br />
30% of students report<br />
financial factors as a major<br />
barrier to success.<br />
Objective Actions Item Evaluation Target<br />
Develop opportunities for<br />
students to expand their<br />
educational experience at<br />
<strong>ELAC</strong> through nonclassroom<br />
activities such as<br />
scientific lectures,<br />
demonstrations, and cultural<br />
events.<br />
Create programs to prevent<br />
“cold assessment” and<br />
prepare students to take<br />
placement exams. {ATD}<br />
Enhance the Transfer<br />
Culture on campus.<br />
Expand awareness of nontraditional<br />
transfer pathways<br />
such as private colleges and outof-state<br />
colleges.<br />
Enhance advisement to students<br />
about financing a college<br />
education, including<br />
understanding university<br />
financial aid and scholarship<br />
award letters.<br />
Entering students will have a<br />
positive perception of <strong>ELAC</strong> as a<br />
center for academic excellence<br />
and community involvement.<br />
Number of high schools<br />
involved in formal partnerships<br />
in 2009-10 via grants or other<br />
special agreements and/or<br />
programs (not regular outreach<br />
activities)<br />
English preparation - % collegeready<br />
Math Preparation - % collegeready<br />
Entering students will have a<br />
positive perception of <strong>ELAC</strong> as a<br />
center for academic excellence<br />
community involvement.<br />
Size of summer bridge program<br />
Size of entering cohort<br />
First‐year persistence<br />
Transfer rate<br />
Student Right-to-Know (SRTK)<br />
Completion/transfer rates<br />
ARCC student progress and<br />
achievement<br />
37 Page <strong>Educational</strong> <strong>Master</strong> <strong>Plan</strong> 2012
Goal<br />
Goal 3:<br />
Sustaining<br />
communitycentered<br />
access,<br />
participation, and<br />
preparation that<br />
improves the<br />
college's presence<br />
in the<br />
community,<br />
maximizes access<br />
to higher<br />
education and<br />
provides outlets<br />
for artistic, civic,<br />
cultural, scientific<br />
and social<br />
expression as<br />
well as<br />
environmental<br />
awareness.<br />
Why Data/Underlying<br />
Factors<br />
26% of students report<br />
commuting to school for more<br />
than eleven hours a week.<br />
Objective Actions Item Evaluation Target<br />
Utilize the college’s online<br />
offerings and existing<br />
learning management<br />
systems to enhance student<br />
access for non-traditional<br />
students and accelerate<br />
progress for on-campus<br />
students.<br />
Create and implement an<br />
orientation for students that<br />
focuses on the utilization of<br />
online resources available at the<br />
college and ways to successfully<br />
complete online and webenhanced<br />
courses.<br />
Size of entering cohort<br />
First‐year persistence<br />
Transfer rate<br />
Student Right-to-Know (SRTK)<br />
Completion/transfer rates<br />
ARCC student progress and<br />
achievement<br />
38 Page <strong>Educational</strong> <strong>Master</strong> <strong>Plan</strong> 2012
Goal<br />
Why Data/Underlying<br />
Factors<br />
Objective Actions Item Evaluation Target<br />
Increase in completion rates<br />
for special programs:<br />
Adelante-15.5%<br />
Athletics-17.7%<br />
Honors-59.7%<br />
Puente-14.3%<br />
Budget reductions requiring a<br />
need for efficient scalability.<br />
Identify and implement<br />
successful elements within<br />
special programs (Honors,<br />
Adelante, Athletics,<br />
Distance Education, etc.)<br />
into other scalable campus<br />
programs.<br />
Budget linked to mission<br />
Data use and awareness<br />
First‐year persistence<br />
Transfer rate<br />
Student Right-to-Know (SRTK)<br />
Completion/transfer rates<br />
ARCC student progress and<br />
achievement<br />
Goal 4:<br />
Ensuring<br />
institutional<br />
effectiveness and<br />
accountability<br />
through datadriven<br />
decisionmaking<br />
as well as<br />
evaluation and<br />
improvement of<br />
all college<br />
programs and<br />
governance<br />
structures.<br />
Need to determine the manner<br />
in which professional<br />
development strategies are<br />
applied in the classroom and to<br />
determine their effectiveness.<br />
46.48% agree that data is<br />
available and usable.<br />
Faculty report lower levels of<br />
satisfaction with data than<br />
administration.<br />
Lack of data on job placement<br />
rates for college programs.<br />
Need to increase efficiency in<br />
disseminating data to the<br />
college public.<br />
Develop a method to<br />
evaluate the effectiveness<br />
and classroom application of<br />
student-centered instruction<br />
strategies offered through<br />
Professional Development.<br />
Develop methods to promote<br />
the use of data at the<br />
departmental level to<br />
enhance decision-making.<br />
Use the results of course- and<br />
program-level Learning<br />
Outcomes that were derived<br />
from robust assessments.<br />
Determine the relationship<br />
between class size and student<br />
success for each discipline.<br />
Develop and roll out a dynamic<br />
interactive dataset for faculty<br />
online use.<br />
Develop methods to assess job<br />
placement rates for<br />
Career/Technical programs.<br />
Budget linked to mission<br />
Data use and awareness<br />
In‐course retention<br />
In‐course success<br />
Data use and awareness<br />
Data use and awareness<br />
Budget linked to mission<br />
In‐course retention<br />
In‐course success<br />
Data use and awareness<br />
Data use and awareness<br />
Budget linked to mission<br />
39 Page <strong>Educational</strong> <strong>Master</strong> <strong>Plan</strong> 2012
Goal<br />
Goal 4:<br />
Ensuring<br />
institutional<br />
effectiveness and<br />
accountability<br />
through datadriven<br />
decisionmaking<br />
as well as<br />
evaluation and<br />
improvement of<br />
all college<br />
programs and<br />
governance<br />
structures.<br />
Why Data/Underlying<br />
Factors<br />
Senate Bill creating Transfer<br />
Model Curriculum.<br />
Reduction in transfer<br />
opportunities at local transfer<br />
partners and a need to increase<br />
the number of transfer<br />
partners.<br />
Divergent state, national and<br />
local definitions of student<br />
completion and the calculation<br />
of rates.<br />
A noted need to expand use of<br />
Learning Outcomes in<br />
programmatic improvement.<br />
Objective Actions Item Evaluation Target<br />
Develop and revise<br />
curriculum to demonstrate<br />
that disciplines are up-todate<br />
and to expand<br />
articulation to more instate/out-of<br />
state/private<br />
four-year<br />
colleges/universities.<br />
Create a college consensus<br />
defining “completion.”<br />
Expand campus dialog on<br />
student outcomes.<br />
Data use and awareness<br />
Data use and awareness<br />
Completion/transfer rates<br />
Data use and awareness<br />
Number of courses changed as a<br />
result of CLOs<br />
Number of programs changed as<br />
a result of PLOs<br />
40 Page <strong>Educational</strong> <strong>Master</strong> <strong>Plan</strong> 2012
Implementation and Evaluation<br />
The approved <strong>Educational</strong> <strong>Master</strong> <strong>Plan</strong> will be fully integrated into the college Program Review process.<br />
Each department and unit will be asked to align their plans with the objectives of the <strong>Educational</strong> <strong>Master</strong><br />
<strong>Plan</strong>. Their plans will be added an action items to each objective and tracked through the Annual Update<br />
<strong>Plan</strong> process to determine the degree to which each Objective is being achieved. The committee will<br />
annually review the degree to which an action item has been completed and the trends of each associated<br />
measurement. Through this implementation process, the <strong>Educational</strong> <strong>Plan</strong>ning Subcommittee will be able<br />
to track which actions are being implemented and how much impact each action has had on the college’s<br />
evaluation targets. The college views this process as an ongoing system of quality improvement. Through<br />
each annual review of the <strong>Educational</strong> <strong>Master</strong> <strong>Plan</strong>, the committee will seek to determine ways to improve<br />
efficiency and effectiveness as the college works toward successful achievement of all of its strategic<br />
measurements.<br />
41 Page <strong>Educational</strong> <strong>Master</strong> <strong>Plan</strong> 2012