ELAC Educational Master Plan - East Los Angeles College
ELAC Educational Master Plan - East Los Angeles College
ELAC Educational Master Plan - East Los Angeles College
You also want an ePaper? Increase the reach of your titles
YUMPU automatically turns print PDFs into web optimized ePapers that Google loves.
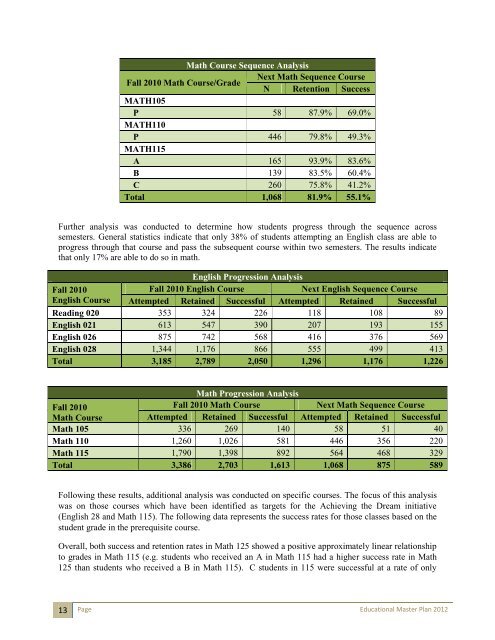
Math Course Sequence Analysis<br />
Fall 2010 Math Course/Grade<br />
Next Math Sequence Course<br />
N Retention Success<br />
MATH105<br />
P 58 87.9% 69.0%<br />
MATH110<br />
P 446 79.8% 49.3%<br />
MATH115<br />
A 165 93.9% 83.6%<br />
B 139 83.5% 60.4%<br />
C 260 75.8% 41.2%<br />
Total 1,068 81.9% 55.1%<br />
Further analysis was conducted to determine how students progress through the sequence across<br />
semesters. General statistics indicate that only 38% of students attempting an English class are able to<br />
progress through that course and pass the subsequent course within two semesters. The results indicate<br />
that only 17% are able to do so in math.<br />
English Progression Analysis<br />
Fall 2010<br />
Fall 2010 English Course<br />
Next English Sequence Course<br />
English Course Attempted Retained Successful Attempted Retained Successful<br />
Reading 020 353 324 226 118 108 89<br />
English 021 613 547 390 207 193 155<br />
English 026 875 742 568 416 376 569<br />
English 028 1,344 1,176 866 555 499 413<br />
Total 3,185 2,789 2,050 1,296 1,176 1,226<br />
Math Progression Analysis<br />
Fall 2010<br />
Fall 2010 Math Course<br />
Next Math Sequence Course<br />
Math Course Attempted Retained Successful Attempted Retained Successful<br />
Math 105 336 269 140 58 51 40<br />
Math 110 1,260 1,026 581 446 356 220<br />
Math 115 1,790 1,398 892 564 468 329<br />
Total 3,386 2,703 1,613 1,068 875 589<br />
Following these results, additional analysis was conducted on specific courses. The focus of this analysis<br />
was on those courses which have been identified as targets for the Achieving the Dream initiative<br />
(English 28 and Math 115). The following data represents the success rates for those classes based on the<br />
student grade in the prerequisite course.<br />
Overall, both success and retention rates in Math 125 showed a positive approximately linear relationship<br />
to grades in Math 115 (e.g. students who received an A in Math 115 had a higher success rate in Math<br />
125 than students who received a B in Math 115). C students in 115 were successful at a rate of only<br />
13 Page <strong>Educational</strong> <strong>Master</strong> <strong>Plan</strong> 2012


