STENA METALL AB - Stena Metall Group
STENA METALL AB - Stena Metall Group
STENA METALL AB - Stena Metall Group

Create successful ePaper yourself
Turn your PDF publications into a flip-book with our unique Google optimized e-Paper software.
Financial review | The <strong>Group</strong><br />
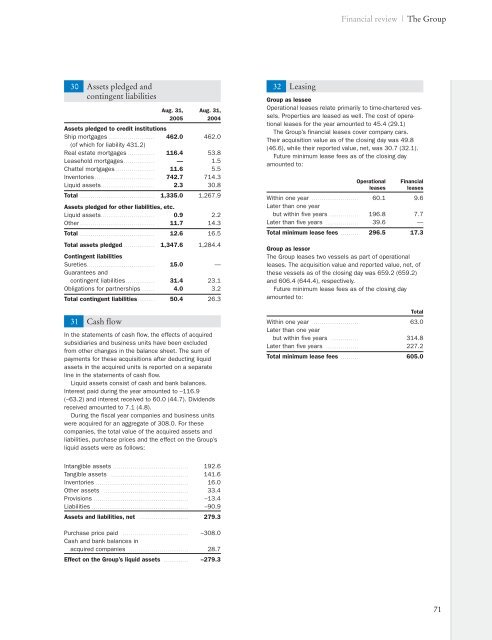
30 Assets pledged and<br />
contingent liabilities<br />
Aug. 31, Aug. 31,<br />
2005 2004<br />
Assets pledged to credit institutions<br />
Ship mortgages . . . . . . . . . . . . . . . . . . . . . . . . 462.0 462.0<br />
(of which for liability 431.2)<br />
Real estate mortgages . . . . . . . . . . . . . . 116.4 53.8<br />
Leasehold mortgages . . . . . . . . . . . . . . . . — 1.5<br />
Chattel mortgages . . . . . . . . . . . . . . . . . . . . 11.6 5.5<br />
Inventories . . . . . . . . . . . . . . . . . . . . . . . . . . . . . . . 742.7 714.3<br />
Liquid assets . . . . . . . . . . . . . . . . . . . . . . . . . . . . 2.3 30.8<br />
Total . . . . . . . . . . . . . . . . . . . . . . . . . . . . . . . . . . . . . . . 1,335.0 1,267.9<br />
Assets pledged for other liabilities, etc.<br />
Liquid assets . . . . . . . . . . . . . . . . . . . . . . . . . . . . 0.9 2.2<br />
Other . . . . . . . . . . . . . . . . . . . . . . . . . . . . . . . . . . . . . . . 11.7 14.3<br />
Total . . . . . . . . . . . . . . . . . . . . . . . . . . . . . . . . . . . . . . . 12.6 16.5<br />
Total assets pledged . . . . . . . . . . . . . . . . . 1,347.6 1,284.4<br />
Contingent liabilities<br />
Sureties . . . . . . . . . . . . . . . . . . . . . . . . . . . . . . . . . . . 15.0 —<br />
Guarantees and<br />
contingent liabilities . . . . . . . . . . . . . . . 31.4 23.1<br />
Obligations for partnerships . . . . . . . 4.0 3.2<br />
Total contingent liabilities . . . . . . . . . 50.4 26.3<br />
31 Cash flow<br />
In the statements of cash flow, the effects of acquired<br />
subsidiaries and business units have been excluded<br />
from other changes in the balance sheet. The sum of<br />
payments for these acquisitions after deducting liquid<br />
assets in the acquired units is reported on a separate<br />
line in the statements of cash flow.<br />
Liquid assets consist of cash and bank balances.<br />
Interest paid during the year amounted to –116.9<br />
(–63.2) and interest received to 60.0 (44.7). Dividends<br />
received amounted to 7.1 (4.8).<br />
During the fiscal year companies and business units<br />
were acquired for an aggregate of 308.0. For these<br />
companies, the total value of the acquired assets and<br />
liabilities, purchase prices and the effect on the <strong>Group</strong>’s<br />
liquid assets were as follows:<br />
32 Leasing<br />
<strong>Group</strong> as lessee<br />
Operational leases relate primarily to time-chartered vessels.<br />
Properties are leased as well. The cost of operational<br />
leases for the year amounted to 45.4 (29.1)<br />
The <strong>Group</strong>’s financial leases cover company cars.<br />
Their acquisition value as of the closing day was 49.8<br />
(46.6), while their reported value, net, was 30.7 (32.1).<br />
Future minimum lease fees as of the closing day<br />
amounted to:<br />
Operational Financial<br />
leases leases<br />
Within one year . . . . . . . . . . . . . . . . . . . . . . . . 60.1 9.6<br />
Later than one year<br />
but within five years . . . . . . . . . . . . . . . 196.8 7.7<br />
Later than five years . . . . . . . . . . . . . . . . . 39.6 —<br />
Total minimum lease fees . . . . . . . . . 296.5 17.3<br />
<strong>Group</strong> as lessor<br />
The <strong>Group</strong> leases two vessels as part of operational<br />
leases. The acquisition value and reported value, net, of<br />
these vessels as of the closing day was 659.2 (659.2)<br />
and 606.4 (644.4), respectively.<br />
Future minimum lease fees as of the closing day<br />
amounted to:<br />
Total<br />
Within one year . . . . . . . . . . . . . . . . . . . . . . . 63.0<br />
Later than one year<br />
but within five years . . . . . . . . . . . . . . 314.8<br />
Later than five years . . . . . . . . . . . . . . . . . 227.2<br />
Total minimum lease fees . . . . . . . . . 605.0<br />
Intangible assets . . . . . . . . . . . . . . . . . . . . . . . . . . . . . . . . . . . . . . . 192.6<br />
Tangible assets . . . . . . . . . . . . . . . . . . . . . . . . . . . . . . . . . . . . . . . . 141.6<br />
Inventories . . . . . . . . . . . . . . . . . . . . . . . . . . . . . . . . . . . . . . . . . . . . . . . . 16.0<br />
Other assets . . . . . . . . . . . . . . . . . . . . . . . . . . . . . . . . . . . . . . . . . . . . 33.4<br />
Provisions . . . . . . . . . . . . . . . . . . . . . . . . . . . . . . . . . . . . . . . . . . . . . . . . . –13.4<br />
Liabilities . . . . . . . . . . . . . . . . . . . . . . . . . . . . . . . . . . . . . . . . . . . . . . . . . . –90.9<br />
Assets and liabilities, net . . . . . . . . . . . . . . . . . . . . . . . . . . 279.3<br />
Purchase price paid . . . . . . . . . . . . . . . . . . . . . . . . . . . . . . . . . . –308.0<br />
Cash and bank balances in<br />
acquired companies . . . . . . . . . . . . . . . . . . . . . . . . . . . . . . . 28.7<br />
Effect on the <strong>Group</strong>’s liquid assets . . . . . . . . . . . . . –279.3<br />
71