


Create successful ePaper yourself
Turn your PDF publications into a flip-book with our unique Google optimized e-Paper software.
22<br />
Article Cover FinLife of the Story Month<br />
NIVESHAK<br />
Fundamental or Technical Analysis:<br />
An Amalgamation of both the<br />
perspectives<br />
Rahul Bajaj<br />
IIM Shillong<br />
“The best way to have a million is to start with two million and trade<br />
in the financial markets using technical analysis “<br />
A lot of negativity has been built over the years<br />
around technical trading, however this powerful<br />
tool when used in conjunction with fundamental<br />
analysis can help enhance the returns of any<br />
trader. Difference between the two perspectives<br />
is that the technical analyst uses statistics and<br />
assets traded volume and historical prices data<br />
to forecast the prices whereas the fundamental<br />
trader calculates the assets intrinsic value<br />
through current performance and future<br />
projections. Technical analysis relies on patterns,<br />
historical prices to repeat in the future whereas<br />
fundamental analysis relies that the expected<br />
company future performance to reflect in the<br />
prices. However it is possible that history and<br />
market behaviour do not repeat in the former,<br />
and market behaviour/sentiment not being in<br />
sync with the fundamentals in the latter. Traders<br />
who invest in assets with good fundamentals at<br />
the right time can help maximise the returns for<br />
investors. Let us look at both the perspectives<br />
and how they can be used together.<br />
Technical analysis is applicable to stocks,<br />
indices, commodities, futures or any tradable<br />
instrument where the price is influenced by<br />
the forces of supply and demand. Technical<br />
analysts use combination of the open, high,<br />
low, or close for a given security over a specific<br />
time frame. The time frame can be based on<br />
intraday (1-minute, 5-minutes, 10-minutes,<br />
15-minutes, 30-minutes or hourly), daily, weekly<br />
or monthly price data and last a few hours<br />
or many years. As it can be done across time<br />
frames, it is possible to find short-term as well<br />
as long-term trends using technical analysis.<br />
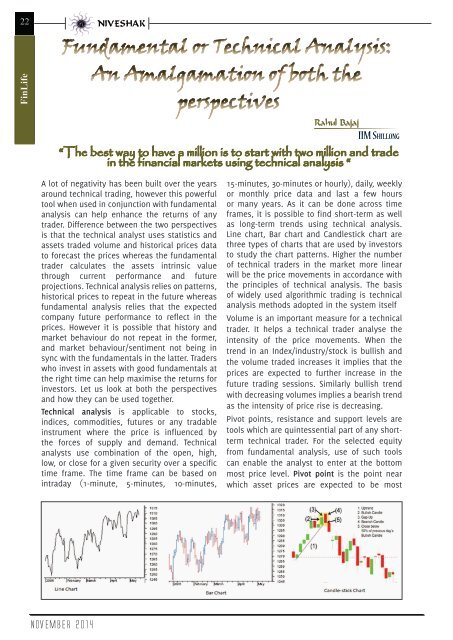
Line chart, Bar chart and Candlestick chart are<br />
three types of charts that are used by investors<br />
to study the chart patterns. Higher the number<br />
of technical traders in the market more linear<br />
will be the price movements in accordance with<br />
the principles of technical analysis. The basis<br />
of widely used algorithmic trading is technical<br />
analysis methods adopted in the system itself<br />
Volume is an important measure for a technical<br />
trader. It helps a technical trader analyse the<br />
intensity of the price movements. When the<br />
trend in an Index/industry/stock is bullish and<br />
the volume traded increases it implies that the<br />
prices are expected to further increase in the<br />
future trading sessions. Similarly bullish trend<br />
with decreasing volumes implies a bearish trend<br />
as the intensity of price rise is decreasing.<br />
Pivot points, resistance and support levels are<br />
tools which are quintessential part of any shortterm<br />
technical trader. For the selected equity<br />
from fundamental analysis, use of such tools<br />
can enable the analyst to enter at the bottom<br />
most price level. Pivot point is the point near<br />
which asset prices are expected to be most<br />
NOVEMBER 2014