


Create successful ePaper yourself
Turn your PDF publications into a flip-book with our unique Google optimized e-Paper software.
24<br />
NIVESHAK<br />
Article Cover FinLife of the Story Month<br />
in the asset prices is halted at the resistance/<br />
support level. In double top reversal pattern<br />
the asset prices attempt to break the resistance<br />
levels twice after which downward trend in price<br />
movement pushes the prices lower. Similarly<br />
in double bottom reversal pattern prices try to<br />
break down below the support level, however<br />
has sustained in those levels by buying seen at<br />
the support level. After the two bounce-offs the<br />
asset prices starts moving in an upward trend.<br />
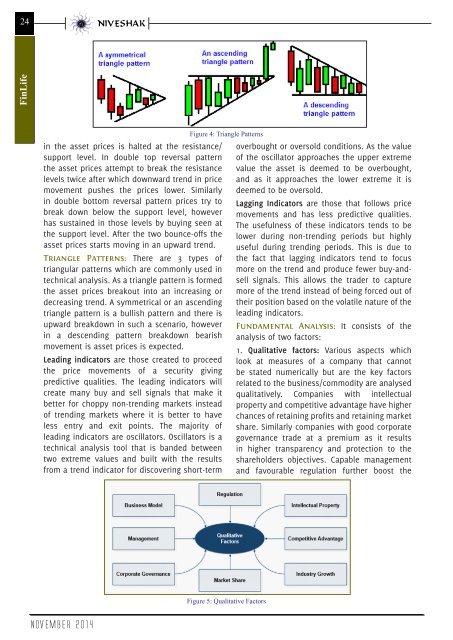
Triangle Patterns: There are 3 types of<br />
triangular patterns which are commonly used in<br />
technical analysis. As a triangle pattern is formed<br />
the asset prices breakout into an increasing or<br />
decreasing trend. A symmetrical or an ascending<br />
triangle pattern is a bullish pattern and there is<br />
upward breakdown in such a scenario, however<br />
in a descending pattern breakdown bearish<br />
movement is asset prices is expected.<br />
Leading indicators are those created to proceed<br />
the price movements of a security giving<br />
predictive qualities. The leading indicators will<br />
create many buy and sell signals that make it<br />
better for choppy non-trending markets instead<br />
of trending markets where it is better to have<br />
less entry and exit points. The majority of<br />
leading indicators are oscillators. Oscillators is a<br />
technical analysis tool that is banded between<br />
two extreme values and built with the results<br />
from a trend indicator for discovering short-term<br />
Figure 4: Triangle Patterns<br />
overbought or oversold conditions. As the value<br />
of the oscillator approaches the upper extreme<br />
value the asset is deemed to be overbought,<br />
and as it approaches the lower extreme it is<br />
deemed to be oversold.<br />
Lagging Indicators are those that follows price<br />
movements and has less predictive qualities.<br />
The usefulness of these indicators tends to be<br />
lower during non-trending periods but highly<br />
useful during trending periods. This is due to<br />
the fact that lagging indicators tend to focus<br />
more on the trend and produce fewer buy-andsell<br />
signals. This allows the trader to capture<br />
more of the trend instead of being forced out of<br />
their position based on the volatile nature of the<br />
leading indicators.<br />
Fundamental Analysis: It consists of the<br />
analysis of two factors:<br />
1. Qualitative factors: Various aspects which<br />
look at measures of a company that cannot<br />
be stated numerically but are the key factors<br />
related to the business/commodity are analysed<br />
qualitatively. Companies with intellectual<br />
property and competitive advantage have higher<br />
chances of retaining profits and retaining market<br />
share. Similarly companies with good corporate<br />
governance trade at a premium as it results<br />
in higher transparency and protection to the<br />
shareholders objectives. Capable management<br />
and favourable regulation further boost the<br />
Figure 5: Qualitative Factors<br />
NOVEMBER 2014