


Create successful ePaper yourself
Turn your PDF publications into a flip-book with our unique Google optimized e-Paper software.
NIVESHAK 23<br />
Article Cover FinLife of the Story Month<br />
volatile. A support level is a price level where<br />
the price tends to find support as it is going<br />
down. This means the price is more likely to<br />
“bounce” off this level rather than break<br />
through it. A resistance level is the opposite of a<br />
support level. It is where the price tends to find<br />
resistance as it is going up. This means the price<br />
is more likely to “bounce” off this level rather<br />
than break through it. However, once the price<br />
has passed this level, by an amount exceeding<br />
some noise, it is likely that it will continue rising<br />
until it finds another resistance level.<br />
Pivot Point for Current = High (previous period) +<br />
Low (previous period) + Close (previous period)<br />
Resistance 1 = (2 x Pivot Point) – Low (previous<br />
period)<br />
Support 1 = (2 x Pivot Point) – High (previous<br />
period)<br />
Resistance 2 = (Pivot Point – Support 1) +<br />
Resistance 1<br />
Support 2 = Pivot Point – (Resistance 1 – Support<br />
1)<br />
Resistance 3 = (Pivot Point – Support 2) +<br />
Resistance 2<br />
Support 3 = Pivot Point – (Resistance 2 – Support<br />
2)<br />
Various Chart patterns like Head and Shoulders,<br />
Cup and Handle, Double<br />
Tops and Bottom etc.<br />
are used to further<br />
analyse the trends<br />
in the prices. Based<br />
on the time frame of<br />
the charts (Hourly,<br />
Daily, monthly,<br />
Yearly) similar time<br />
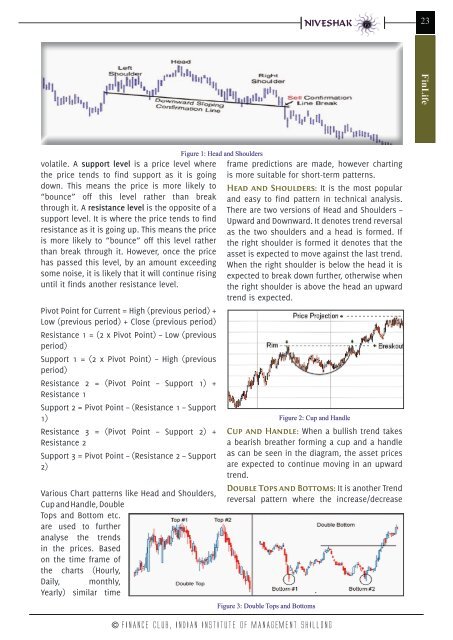
Figure 1: Head and Shoulders<br />
frame predictions are made, however charting<br />
is more suitable for short-term patterns.<br />
Head and Shoulders: It is the most popular<br />
and easy to find pattern in technical analysis.<br />
There are two versions of Head and Shoulders –<br />
Upward and Downward. It denotes trend reversal<br />
as the two shoulders and a head is formed. If<br />
the right shoulder is formed it denotes that the<br />
asset is expected to move against the last trend.<br />
When the right shoulder is below the head it is<br />
expected to break down further, otherwise when<br />
the right shoulder is above the head an upward<br />
trend is expected.<br />
Figure 2: Cup and Handle<br />
Cup and Handle: When a bullish trend takes<br />
a bearish breather forming a cup and a handle<br />
as can be seen in the diagram, the asset prices<br />
are expected to continue moving in an upward<br />
trend.<br />
Double Tops and Bottoms: It is another Trend<br />
reversal pattern where the increase/decrease<br />
Figure 3: Double Tops and Bottoms<br />
© FINANCE CLUB, INDIAN INSTITUTE Of MANAGEMENT SHILLONG