3000 kb - Mid Western Regional Council - NSW Government
3000 kb - Mid Western Regional Council - NSW Government
3000 kb - Mid Western Regional Council - NSW Government

Create successful ePaper yourself
Turn your PDF publications into a flip-book with our unique Google optimized e-Paper software.
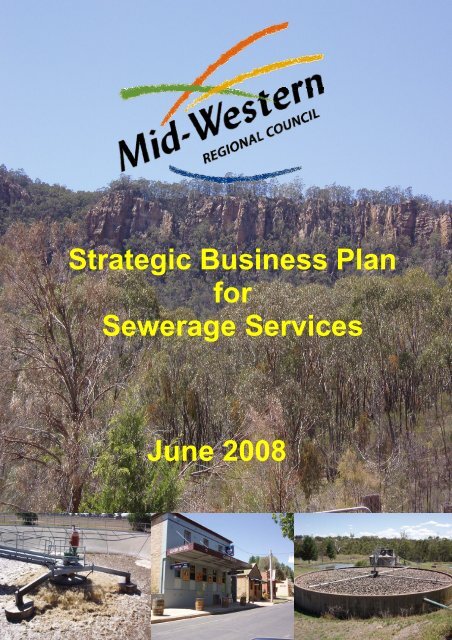
Strategic Business Plan<br />
for<br />
Sewerage Services<br />
June 2008
Acknowledgment<br />
This Strategic Business Plan was prepared by <strong>Mid</strong>-<strong>Western</strong> <strong>Regional</strong> <strong>Council</strong> with the<br />
assistance of the Strategic Water Management Unit of Sustainable Water Solutions, <strong>NSW</strong><br />
Department of Commerce.<br />
The Plan is based on a workshop held on 15 - 16 February 2007 in which senior <strong>Council</strong><br />
staff were represented.<br />
<strong>Mid</strong>-<strong>Western</strong> <strong>Regional</strong> <strong>Council</strong><br />
Strategic Business Plan for Sewerage
Strategic Business Plan for Sewerage<br />
<strong>Mid</strong>-<strong>Western</strong> <strong>Regional</strong> <strong>Council</strong>
Contents<br />
Summary .............................................................................................................................i<br />
Introduction........................................................................................................................1<br />
Why This Plan Has Been Developed .......................................................................1<br />
Structure of the Plan ................................................................................................3<br />
PART A: OPERATING ENVIRONMENT ............................................................................5<br />
<strong>Council</strong>’s Vision and Mission ...........................................................................................7<br />
Operating Environment.....................................................................................................9<br />
Sewerage Scheme ...........................................................................................................13<br />
Existing Sewerage Scheme ...................................................................................13<br />
Future Development...............................................................................................20<br />
Levels of Service .............................................................................................................23<br />
Principal Issues ...............................................................................................................27<br />
Best Practice Management .............................................................................................29<br />
PART B: STRATEGIC PLAN............................................................................................31<br />
Planning Strategy ............................................................................................................33<br />
Customer Service ............................................................................................................37<br />
Levels of Service Review.......................................................................................38<br />
Areas Serviced.......................................................................................................40<br />
Sewer Load Management ......................................................................................43<br />
Service Pricing .......................................................................................................47<br />
Customer Relations................................................................................................50<br />
Community Involvement.........................................................................................52<br />
Environment.....................................................................................................................55<br />
Integrated Water Cycle Management (IWCM) .......................................................56<br />
Asset Management..........................................................................................................59<br />
Operations Plan .....................................................................................................62<br />
Maintenance Plan ..................................................................................................65<br />
Capital Works.........................................................................................................68<br />
Human Resources ...........................................................................................................71<br />
Finance .............................................................................................................................75<br />
PART C: DETAILED INFORMATION...............................................................................77<br />
Financial Management ....................................................................................................79<br />
Overview of Financial Planning..............................................................................79<br />
Model Description ..................................................................................................80<br />
Modelling Methodology ..........................................................................................80<br />
Projected Cost Schedules ..............................................................................................85<br />
Financial Modelling Outcomes.......................................................................................91<br />
Operating Environment Review .....................................................................................97<br />
Institutional Arrangements .....................................................................................97<br />
Legislative Framework .........................................................................................100<br />
Stakeholder Analysis............................................................................................100<br />
<strong>Mid</strong>-<strong>Western</strong> <strong>Regional</strong> <strong>Council</strong><br />
Strategic Business Plan for Sewerage
Service Provision ................................................................................................. 100<br />
Corporate Policies and Practices......................................................................... 101<br />
Service Delivery................................................................................................... 101<br />
APPENDICES ................................................................................................................. 105<br />
Figures<br />
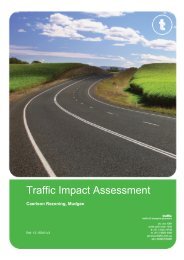
Figure 1 - Map of <strong>Mid</strong>-<strong>Western</strong> <strong>Regional</strong> <strong>Council</strong> ............................................................. 15<br />
Figure 2 – Map of Mudgee Sewerage Service Area ......................................................... 16<br />
Figure 3 – Map of Gulgong Sewerage Service Area......................................................... 17<br />
Figure 4 – Map of Rylstone Sewerage Service Area ........................................................ 18<br />
Figure 5 – Map of Kandos Sewerage Service Area .......................................................... 19<br />
Figure 6 – <strong>Mid</strong>-<strong>Western</strong> <strong>Regional</strong> <strong>Council</strong> Population Growth Projections ....................... 20<br />
Figure 7 - Best Practice Asset Management Approach .................................................... 59<br />
Figure 8 - Operations Flowchart........................................................................................ 62<br />
Figure 9 - Maintenance Flowchart..................................................................................... 65<br />
Figure 10 - Capital Works Flowchart ................................................................................. 68<br />
Figure 11 – <strong>Mid</strong>-<strong>Western</strong> <strong>Council</strong> Organisation Structure................................................. 72<br />
Figure 12 - Detailed Capital Works Schedule for Sewerage ............................................. 87<br />
Figure 13 - Detailed Recurrent Cost Schedule for Sewerage ........................................... 88<br />
Figure 14 - Capital Works Plan for Sewerage ................................................................... 89<br />
Figure 15 – Recurrent Cost Plan for Sewerage ................................................................ 89<br />
Figure 16 - Sewerage Capital Works Summary ................................................................ 90<br />
Figure 17 - Typical Residential Bill for Sewerage.............................................................. 91<br />
Figure 18 - Cash and Borrowing Projection for Sewerage ................................................ 92<br />
Figure 19 - Projected Financial Results for Sewerage ...................................................... 93<br />
Figure 20 - Sensitivity of Typical Residential Bill for Sewerage ........................................ 94<br />
Figure 21 - Sensitivity of Cash Levels for Sewerage......................................................... 94<br />
Figure 22 - Sensitivity on Borrowing Levels for Sewerage................................................ 95<br />
Figure 23 - Effect of Sensitivity on the Typical Residential Bill for Sewerage ................... 95<br />
Strategic Business Plan for Sewerage<br />
<strong>Mid</strong>-<strong>Western</strong> <strong>Regional</strong> <strong>Council</strong>
Appendices<br />
Appendix A Abbreviations<br />
Appendix B Legislation Affecting Sewerage Services<br />
Appendix C Stakeholder Review<br />
Appendix D Performance Indicators<br />
Appendix E Financial Input Data<br />
Appendix F Detailed Projected Financial Statements<br />
<strong>Mid</strong>-<strong>Western</strong> <strong>Regional</strong> <strong>Council</strong><br />
Strategic Business Plan for Sewerage
<strong>Mid</strong>-<strong>Western</strong> <strong>Regional</strong> <strong>Council</strong><br />
Strategic Business Plan for Sewerage<br />
June 2008<br />
Summary<br />
Introduction<br />
This Strategic Business Plan covers the development and operation of <strong>Mid</strong>-<strong>Western</strong><br />
<strong>Regional</strong> <strong>Council</strong>’s Sewerage Schemes. It provides supporting information for <strong>Council</strong>'s<br />
Management Plan which is developed during February-November each year and updated<br />
annually.<br />
Corporate Vision<br />
<strong>Council</strong>’s corporate vision is to:<br />
A progressive and prosperous community that we proudly call home.<br />
Corporate Mission<br />
The corporate mission of the <strong>Council</strong> is:<br />
To pursue a high standard of living for our citizens, preserving the<br />
diversity and character of the <strong>Council</strong>’s region and natural environment<br />
Corporate Objective for Sewerage<br />
<strong>Council</strong> has adopted the following objective for its sewerage services:<br />
To provide sewerage services in an efficient manner to the agreed<br />
and currently recognised health, environmental and other community<br />
standards and needs with flexibility to promote and meet<br />
development demands within the Region<br />
<strong>Council</strong>’s corporate policies and objectives also place specific requirements on the<br />
sewerage scheme. These are detailed in Part C of this Business Plan under Operating<br />
Environment Review.<br />
<strong>Mid</strong>-<strong>Western</strong> <strong>Regional</strong> <strong>Council</strong> Summary Page i<br />
Strategic Business Plan for Sewerage
Scheme Outline<br />
<strong>Mid</strong>-<strong>Western</strong> <strong>Regional</strong> <strong>Council</strong> has a sewerage area of 1860 Ha with a population of<br />
13,100 covering the townships of Mudgee, Gulgong, Rylstone and Kandos.<br />
<strong>Council</strong> operates and maintains 174 Km of reticulation network, 12 pumping stations and<br />
10 Km of rising mains. The treatment system comprises four sewage treatment plants,<br />
one each for the townships serviced, with a total capacity of 16,750 EP.<br />
Descriptions and schematics of service areas of Mudgee, Gulgong, Rylstone and Kandos<br />
sewerage schemes are presented in Part A of this Business Plan.<br />
Operating Environment Review<br />
This review explores the internal and external conditions under which <strong>Council</strong> delivers<br />
services now and those likely to prevail in the future. Details are provided in Part A of this<br />
Business Plan.<br />
Principal Issues<br />
Current services are generally satisfactory. There are however, some issues which need<br />
to be addressed. These are:<br />
• Meeting DWE Best Practice Management Guidelines and other<br />
government regulations<br />
• Augmenting STPs to meet conditions of Load Reduction Agreement with<br />
DECC<br />
• Establishing priorities for extension of services<br />
• Equitable service pricing including developer charges across the Region<br />
• Developing asset management system including maintaining real-time<br />
asset condition data/details<br />
• Managing and funding long-term capital works<br />
Service Provision<br />
Levels of Service<br />
<strong>Council</strong>'s primary objective with sewerage services is to meet the adopted Levels of<br />
Service, which cover the following areas:<br />
• Service complaints<br />
• System failures<br />
• Response times<br />
• Odour complaints<br />
• Flow problems<br />
• Discharge quality<br />
Levels of Service with predicted improvements are summarised on the following page.<br />
Page ii Summary <strong>Mid</strong>-<strong>Western</strong> <strong>Regional</strong> <strong>Council</strong><br />
Strategic Business Plan for Sewerage
Summary of Levels of Service Improvements<br />
DESCRIPTION<br />
UNIT<br />
LEVEL OF SERVICE<br />
Current Target (2012)<br />
Availability of Service<br />
− Extent of area serviced % Designated<br />
Service area<br />
100% Urban areas<br />
of Mudgee,<br />
Gulgong, Rylstone<br />
and Kandos<br />
100% of Urban<br />
areas of Mudgee,<br />
Gulgong, Rylstone,<br />
Kandos, Clandulla<br />
and Charbon<br />
System Failures<br />
Category One:<br />
−<br />
Failure due to rainfall and deficient<br />
capacity (overflows)<br />
Category Two:<br />
−<br />
Failures due to pump or other<br />
breakdown including power failure<br />
Category Three:<br />
−<br />
Failures due to main blockages and<br />
collapses<br />
No./year 10 4<br />
No./ year<br />
6 due to<br />
maintenance<br />
12 due to power<br />
failure<br />
6 due to<br />
maintenance<br />
12 due to power<br />
failure (standby<br />
pumps provided)<br />
No./ year 300 250<br />
Response Times for Complaints<br />
General Complaints and Inquiries:<br />
−<br />
Written complaints<br />
Working days<br />
10<br />
10<br />
−<br />
Personal/Oral complaints<br />
Working days<br />
1<br />
1<br />
Note: Times apply for 95% of<br />
occasions<br />
Odour Complaints:<br />
−<br />
Treatment works (outside<br />
designated buffer zone)<br />
No. /year<br />
2<br />
0<br />
−<br />
Pumping Stations<br />
No. /year<br />
0<br />
0<br />
−<br />
Reticulation system<br />
No./year<br />
0<br />
0<br />
For a full list of the Levels of Service see Part A, Levels of Service.<br />
<strong>Mid</strong>-<strong>Western</strong> <strong>Regional</strong> <strong>Council</strong> Summary Page iii<br />
Strategic Business Plan for Sewerage
Objectives<br />
<strong>Council</strong> has recognised five Key Result Areas that must be managed well to achieve<br />
success in the long-term provision of sewerage services to its customers. These are:<br />
• Customer service,<br />
• Environment,<br />
• Asset management,<br />
• Human resources, and<br />
• Finance.<br />
Objectives and Performance Targets have been set in these Key Result Areas. These<br />
are summarised on page v, and given in detail in Part B of this Plan.<br />
Actions<br />
Strategies were identified for achieving the objectives, and then specific actions were<br />
listed for implementation of these strategies.<br />
The notable actions and outcomes <strong>Council</strong> will take over the next 10 years include:<br />
• Mudgee STP augmentation<br />
• Mudgee trunk main construction (capacity issues)<br />
• Combined Rylstone/Kandos STP<br />
• Clandulla/Charbon sewerage scheme<br />
• Gulgong STP augmentation<br />
• Reticulation mains replacement<br />
• Telemetry upgrade<br />
Page iv Summary <strong>Mid</strong>-<strong>Western</strong> <strong>Regional</strong> <strong>Council</strong><br />
Strategic Business Plan for Sewerage
Objectives<br />
Key Result Area Objective Performance Target<br />
Customer Service<br />
Provide services that meet the<br />
agreed LOS and are<br />
economically feasible and<br />
financially affordable and meet<br />
health and environmental<br />
requirements<br />
To provide services to existing<br />
areas at current levels and<br />
extend to new residential and<br />
industrial areas on a user pays<br />
basis<br />
Operate the sewerage system<br />
in an efficient and<br />
environmentally sound manner<br />
and reduce wet weather<br />
hydraulic sewerage loading to<br />
its economic limit and manage<br />
industrial and commercial<br />
biological load in accordance<br />
with DWE Trade Waste<br />
guidelines<br />
An equitable pricing policy that<br />
supports current and future<br />
service provision based on full<br />
cost recovery and user pays<br />
basis and maximise revenue<br />
from grants and other sources<br />
Provide a high level of<br />
customer satisfaction with<br />
reduced level of substantiated<br />
complaints and keep the<br />
customers informed of<br />
significant issues<br />
Seek community feedback with<br />
regard to service targets and<br />
prior to any major decisions<br />
regarding significant changes<br />
in service levels<br />
Compliance with levels of<br />
service and action planning<br />
and meet performance targets<br />
Provide service in advance of<br />
demand where economically<br />
viable<br />
Review and update<br />
Development Servicing Plans<br />
(DSP) by June 2008<br />
Achieve peak wet weather flow<br />
of less than five times average<br />
dry weather flow by 2018<br />
Adopt Trade Waste Policy by<br />
December 2008<br />
Full implementation of<br />
developer charges from July<br />
2008<br />
Implementation of best practice<br />
pricing from July 2009<br />
Implement new customer<br />
service request system by<br />
September 2008<br />
Conduct annual customer<br />
satisfaction survey<br />
Consultation for sewerage<br />
augmentation strategies<br />
<strong>Mid</strong>-<strong>Western</strong> <strong>Regional</strong> <strong>Council</strong> Summary Page v<br />
Strategic Business Plan for Sewerage
Key Result Area Objective Performance Target<br />
Environment<br />
Asset Management<br />
Human Resources<br />
Finance<br />
An ecologically sustainable<br />
scheme whose environmental<br />
impacts, especially in sensitive<br />
areas, are acceptable to the<br />
community<br />
Develop operations plan and<br />
procedures to achieve levels of<br />
service with due diligence and<br />
effective use of technology so<br />
as to ensure a reliable and safe<br />
service at minimum operating<br />
costs<br />
Increase the reliability of<br />
systems, reduce life cycle and<br />
ongoing costs, allow for<br />
appropriate financial planning<br />
and ensure levels of service<br />
are maintained<br />
Capital works program<br />
provides agreed levels of<br />
service at optimal life-cycle<br />
costs to meet social, economic<br />
and environmental<br />
considerations<br />
Maintain an appropriate staff<br />
structure and staff numbers<br />
with the necessary training and<br />
skills to effectively manage the<br />
sewerage schemes and<br />
provide agreed and required<br />
Levels of Service<br />
Maintain sound financial<br />
management of the<br />
organisation by optimising long<br />
term (30-years) financial plans<br />
to provide required services at<br />
an affordable level and ensure<br />
full cost recovery<br />
Prepare IWCM plan by<br />
December 2008<br />
Update annual State of the<br />
Environment (SOE) Report to<br />
highlight <strong>Council</strong>’s responsible<br />
management of the<br />
environment.<br />
Operate in accordance with<br />
Department of Environment<br />
and Climate Change (DECC)<br />
licences<br />
Undertake operations analysis<br />
by December 2008<br />
No failures to deliver agreed<br />
Levels of Service due to<br />
operations related problems<br />
Review maintenance strategy<br />
by June 2009<br />
No failures to deliver agreed<br />
Levels of Service due to lack of<br />
infrastructure and sufficient<br />
infrastructure is in place to<br />
cater for the projected<br />
developments<br />
Review and update HR Plan by<br />
June 2008<br />
Quarterly review and annual<br />
updating of financial plan<br />
Page vi Summary <strong>Mid</strong>-<strong>Western</strong> <strong>Regional</strong> <strong>Council</strong><br />
Strategic Business Plan for Sewerage
Summary of Projected Financial Position<br />
Following Table presents the summary of projected financial position of <strong>Mid</strong>-<strong>Western</strong><br />
<strong>Regional</strong> <strong>Council</strong>’s sewer fund over the next 30 years at five-year intervals. The typical<br />
annual residential bill forecast for the same period is shown graphically below this Table.<br />
The values are all in 2006/07 dollars.<br />
Summary of Projected Financial Position<br />
2006/07 $ (000) 2006/07 2010/11 2015/16 2020/21 2025/26 2030/31 2035/36<br />
Estimated Total Revenue 3,482 3,929 4,335 4,580 4,881 5,238 5,666<br />
Estimated Total Expenditure 2,829 4,060 4,142 4,681 4,944 4,782 4,784<br />
Operating Surplus / (Deficit) 653 (131) 193 (100) (63) 456 883<br />
Acquisition of Assets 814 6,484 345 2,645 3,345 345 345<br />
Principal Loan Payments 53 376 474 662 923 457 486<br />
Borrowings Outstanding 909 11,896 9,104 11,580 11,042 5,874 2,876<br />
Cash and Investments 6,483 1,836 2,902 1,206 1,193 2,966 8,228<br />
Total Assets 25,537 40,663 39,361 43,383 43,996 41,112 41,614<br />
Total Liabilities 1,033 12,037 9,261 11,750 11,224 6,069 3,084<br />
Financial modelling has demonstrated that typical residential bills, measured in 2006/07<br />
dollars, have to be increased to $490 p.a. from the present (2007/08) level of $460 p.a.<br />
from year 2008/09 onwards throughout the plan period as major capital works are planned<br />
during the next five years. The financial model has considered that 25% of the total<br />
estimated cost of Mudgee STP augmentation work will be available as government<br />
subsidy.<br />
This level of charges is sufficient to maintain liquidity with a minimum of $ 1000,000 of<br />
cash in hand over the period. A graphical presentation of the typical bills forecast is shown<br />
below.<br />
Typical Residential Sewerage Bills<br />
500<br />
490<br />
490<br />
490<br />
490<br />
490<br />
490<br />
490<br />
480<br />
470<br />
460<br />
460<br />
450<br />
2006/07<br />
2007/08<br />
2008/09<br />
2009/10<br />
2010/11<br />
2011/12<br />
2012/13<br />
2013/14<br />
2014/15<br />
2015/16<br />
2016/17<br />
2017/18<br />
2018/19<br />
2019/20<br />
2020/21<br />
2021/22<br />
2022/23<br />
2023/24<br />
2024/25<br />
2025/26<br />
2026/27<br />
2027/28<br />
2028/29<br />
2029/30<br />
2030/31<br />
2031/32<br />
2032/33<br />
2033/34<br />
2034/35<br />
2035/36<br />
Real $<br />
Financial Year<br />
<strong>Mid</strong>-<strong>Western</strong> <strong>Regional</strong> <strong>Council</strong> Summary Page vii<br />
Strategic Business Plan for Sewerage
All the renewal capital works will be internally funded throughout the projection period.<br />
Capital expenditure for major growth works planned for the next 15 years will be through<br />
mix of internal funds, government subsidy and external borrowing with the maximum<br />
utilisation of existing cash reserves and revenues.<br />
The borrowing outstanding is expected to reach a peak of $ 12,606 K in 2021/22, but can<br />
be fully retired, if so required by <strong>Council</strong>, towards the end of the 30-year plan period.<br />
See Part C for more financial projection details.<br />
Page viii Summary <strong>Mid</strong>-<strong>Western</strong> <strong>Regional</strong> <strong>Council</strong><br />
Strategic Business Plan for Sewerage
Introduction<br />
Why This Plan Has Been Developed<br />
The Local <strong>Government</strong> Act 1993 requires <strong>Council</strong> to prepare Management Plans and<br />
Annual Reports. The Management Plan must cover each of <strong>Council</strong>’s principal<br />
business activities and must include items such as:<br />
• Proposed objectives and<br />
performance targets;<br />
• Strategies for their<br />
achievement;<br />
• Proposed capital works<br />
program;<br />
Sewerage<br />
St rat egic<br />
Business Plan<br />
Wat er Supply<br />
St rat egic Business<br />
Plan<br />
• Financial information;<br />
• Revenue policy;<br />
• Human resource activities;<br />
Parks &<br />
Gardens<br />
<strong>Council</strong>’s<br />
Management<br />
Plan<br />
Roads<br />
• Environment protection plan;<br />
Drainage<br />
• Asset replacement<br />
programs;<br />
Ot hers<br />
• Other specific planning<br />
information considered<br />
relevant.<br />
Strategic Business Plans address single business activities, in this case the sewerage<br />
services. The relationship between <strong>Council</strong>’s Management Plan and the Strategic<br />
Business Plans for the various areas is shown on the right.<br />
The difference between the plans is that the Strategic Business Plan has a long-term<br />
strategic approach focussing on a review of the whole of the operating environment for<br />
that particular service. Typically the Strategic Business Plan looks at a minimum of twenty<br />
years ahead while the Management Plan focuses on 3 to 5 years.<br />
Strategic Planning Benefits<br />
The strategic business plan aim to:<br />
• Provide information for <strong>Council</strong>'s Management Plan;<br />
• Detail information for ratepayers and customers, elected representatives,<br />
management, staff, <strong>Government</strong> and relevant external bodies;<br />
• Focus attention on the key issues affecting day to day operations;<br />
• Explore how to share the limited resources available in an equitable<br />
manner;<br />
• Demonstrate to stakeholders that the schemes are well managed;<br />
<strong>Mid</strong>-<strong>Western</strong> <strong>Regional</strong> <strong>Council</strong> Introduction Page 1<br />
Strategic Business Plan for Sewerage
• Identify financial and other resources required to operate these services on<br />
a commercial basis;<br />
• Provide a long term price path for each service;<br />
• Assist in development of an affordable capital works program;<br />
• Enable <strong>Council</strong> to model ‘what-if’ scenarios and see their rating impact; and<br />
• Allow future financial performance indicators to be calculated, such as<br />
return on capital invested.<br />
Strategic Business Plans are considered desirable for all councils but specifically DWE<br />
has now made them a prerequisite for the provision of financial assistance. Some other<br />
drivers for the production of strategic business plans include the need to meet<br />
requirements from:<br />
• Department of Local <strong>Government</strong> (DLG) – Competitive neutrality;<br />
• <strong>Council</strong> of Australian <strong>Government</strong>s (COAG) – National water Reform,<br />
National competition policy;<br />
• Local <strong>Government</strong> and Shires Associations (LGSA) – Benchmarking; and<br />
• Independent Pricing and Regulatory Tribunal (IPART) – Pricing Principles.<br />
The Plan also communicates scheme information to stakeholders and demonstrates that<br />
the scheme is being well managed.<br />
Planning Cycle<br />
Management<br />
Report<br />
Annual<br />
Report<br />
Capital<br />
Works<br />
Financial Accounts<br />
Audit<br />
Financial<br />
Review<br />
SBP<br />
Review<br />
Budget<br />
Management Plan<br />
July October January March June<br />
Financial Report<br />
Page 2 Introduction <strong>Mid</strong>-<strong>Western</strong> <strong>Regional</strong> <strong>Council</strong><br />
Strategic Business Plan for Sewerage
Structure of the Plan<br />
The strategic business plan is presented in three parts. The elements of each part are<br />
shown on the diagram below.<br />
Summary<br />
Vision and Mission for<br />
<strong>Mid</strong>-<strong>Western</strong> <strong>Regional</strong><br />
<strong>Council</strong><br />
Operating Environment<br />
Review<br />
Sewerage Schemes<br />
Introduction<br />
Part A<br />
Operat ing<br />
Environment<br />
Levels of Service<br />
Principal Issues incl. Best<br />
Practice Management<br />
Current operation<br />
and controlling<br />
factors<br />
Customer Service<br />
Environment<br />
Part B<br />
St rat egic Plan<br />
Asset Management<br />
Human Resources<br />
Finance<br />
Objectives,<br />
performance targets<br />
and strategies<br />
Part C<br />
Det ailed<br />
Informat ion<br />
Financial<br />
Modelling and<br />
Stakeholders<br />
Review<br />
Appendices<br />
<strong>Mid</strong>-<strong>Western</strong> <strong>Regional</strong> <strong>Council</strong> Introduction Page 3<br />
Strategic Business Plan for Sewerage
PART A:<br />
OPERATING ENVIRONMENT<br />
Part A of the Plan provides a review of the<br />
system and the operating environment prior<br />
to undertaking planning. Part A is the<br />
starting point of the planning process and<br />
comprises:<br />
<br />
<br />
<br />
<br />
<br />
<br />
Vision and Mission of <strong>Mid</strong>-<strong>Western</strong><br />
<strong>Regional</strong> <strong>Council</strong> looking to a 30-year<br />
planning horizon<br />
Operating Environment<br />
Review of Existing Sewerage Scheme<br />
Levels of Service<br />
Principal Issues<br />
Best Practice Management.<br />
Part B is the Strategic Plan for the<br />
sewerage schemes, and Part C is the<br />
Detailed Information for achieving the<br />
Business Plan’s performance targets.<br />
<strong>Mid</strong>-<strong>Western</strong> <strong>Regional</strong> <strong>Council</strong> Part A - Operating Environment Page 5<br />
Strategic Business Plan for Sewerage
Page 6 Part A - Operating Environment <strong>Mid</strong>-<strong>Western</strong> <strong>Regional</strong> <strong>Council</strong><br />
Strategic Business Plan for Sewerage
<strong>Council</strong>’s Vision and Mission<br />
This section contains <strong>Council</strong>’s corporate vision and mission<br />
statements which indicate the future planning direction<br />
Strategic planning aims to optimise service delivery in terms of long term cost<br />
effectiveness and sustainability and the prime driver is <strong>Council</strong>’s vision of the future and<br />
definition of a mission statement.<br />
Corporate Vision<br />
<strong>Council</strong>’s corporate vision is:<br />
A progressive and prosperous community that we proudly call home.<br />
Corporate Mission<br />
The corporate mission of the <strong>Council</strong> is:<br />
To pursue a high standard of living for our citizens, preserving the<br />
diversity and character of the <strong>Council</strong>’s region and natural environment<br />
Corporate Objective for Sewerage<br />
<strong>Council</strong> has adopted the following objective for its sewerage services:<br />
To provide sewerage services in an efficient manner to the agreed<br />
and currently recognised health, environmental and other community<br />
standards and needs with flexibility to promote and meet<br />
development demands within the Region<br />
<strong>Mid</strong>-<strong>Western</strong> <strong>Regional</strong> <strong>Council</strong> Part A - Operating Environment Page 7<br />
Strategic Business Plan for Sewerage
The implications of <strong>Council</strong>’s vision and mission statements for the provision of the<br />
sewerage services are:<br />
• To strive for excellence in customer service;<br />
• To ensure a sustainable future;<br />
• To have a strong economic base;<br />
• To meet community expectations;<br />
• To maintain suitably experienced staff;<br />
• To provide necessary services efficiently;<br />
• To be dynamic and responsive to change; and<br />
• To be environmentally committed and responsible.<br />
In order to continue effective service provision <strong>Council</strong> needs the support of the<br />
community. For this to occur, however, the general public needs to become more aware<br />
and knowledgeable about sewerage planning issues.<br />
Page 8 Part A - Operating Environment <strong>Mid</strong>-<strong>Western</strong> <strong>Regional</strong> <strong>Council</strong><br />
Strategic Business Plan for Sewerage
Operating Environment<br />
The delivery of sewerage services to the schemes’ customers is subject to a large number<br />
of constraints, requirements, guidelines and other factors, which collectively are referred<br />
to as the operating environment. The five major elements of the operating environment<br />
are shown in the chart below.<br />
Institutional<br />
arrangements<br />
Legislation<br />
Stakeholders<br />
<strong>Council</strong>'s<br />
corporate<br />
policies and<br />
objectives<br />
Sewerage<br />
Scheme<br />
<strong>Regional</strong><br />
development<br />
Delivery of<br />
Service<br />
Customers<br />
<strong>Mid</strong>-<strong>Western</strong> <strong>Regional</strong> <strong>Council</strong> Part A - Operating Environment Page 9<br />
Strategic Business Plan for Sewerage
In expanding <strong>Council</strong>’s vision for a 30-year planning horizon for sewerage services,<br />
changing service requirements due to the following key factors influencing the operating<br />
environment are to be accounted for:<br />
Growth and Development<br />
• Age profile – the trend of aging population with higher middle-aged (40-64<br />
years) and senior population (65-79 years) will continue<br />
• Falling occupancy rate – expected to reach the natural minimum in line with<br />
the national trend away from large families, leading to more households<br />
with less people per ET.<br />
• Strong commercial development is expected to continue resulting in more<br />
people migrating to the region generating greater demand for<br />
accommodation and water services<br />
• Number of wineries and fruit/vegetable processing industries, cattle/sheep<br />
farms is increasing<br />
• A new mine (Moolarben) and the expansion of an existing mine (Ulan) are<br />
expected to be operational within next 1-3 years<br />
Public Health<br />
• The Region provides good medical services with hospitals in the townships<br />
of Mudgee, Gulgong and Rylstone.<br />
• <strong>Council</strong> has commissioned the <strong>NSW</strong> Rural Doctors Network to study the<br />
viability of increased access to general health practitioners and allied health<br />
professionals in the Region.<br />
Environment<br />
• Dry land salinity is a persistent problem in many locations in the Region<br />
• The Shire has good air quality and there is no need for extensive<br />
monitoring or air pollution control programs<br />
• All creeks and rivers in the <strong>Council</strong> LGA are classified as environmentally<br />
sensitive river systems. There is a continuing need for a well-planned<br />
ongoing water quality monitoring program in the region encompassing the<br />
upper Cudgegong River<br />
Transport<br />
• Reconstruction of Castlereagh Highway between Lithgow – Mudgee has<br />
provided faster access to and from the Region to Sydney and major<br />
centres around the region<br />
• Mudgee has reliable twice daily air link with Sydney<br />
Page 10 Part A - Operating Environment <strong>Mid</strong>-<strong>Western</strong> <strong>Regional</strong> <strong>Council</strong><br />
Strategic Business Plan for Sewerage
Tourism<br />
• As part of their Economic Development Strategy, <strong>Council</strong> has recently<br />
completed a 10-year Tourism Study, which indicated that the Region<br />
continues to show strong growth in tourism, and the trend is expected to<br />
continue in future. The study has identified programs and funding<br />
requirements to provide a major boost to the growth of tourism in the<br />
Region<br />
Technology and Information<br />
• Sophisticated information management would provide better financial and<br />
operational analysis and lead to continual service improvement.<br />
• Power supply in the Region is unreliable due to frequent outages. <strong>Council</strong><br />
has provided diesel pumps at critical pumping stations as a contingency<br />
measure in case of power outages. Reliable power supply will improve<br />
service quality in future<br />
• Mobile coverage is improving. ADSL/ Broadband Internet is expanding<br />
covering all townships and 5 Km radius around them. Improvements will<br />
enhance opportunities for growth and development of the Region and<br />
improve quality of other services<br />
<strong>Government</strong> Legislation/ Policy<br />
• More regulation, stringent enforcement and fewer subsidies from<br />
<strong>Government</strong> is imposing heavy burden on <strong>Council</strong> responsibilities<br />
• <strong>Council</strong> has entered into a strategic alliance with Lithgow and Oberon<br />
<strong>Council</strong>s in many areas including asset management, information<br />
technology and tourism<br />
<strong>Mid</strong>-<strong>Western</strong> <strong>Regional</strong> <strong>Council</strong> Part A - Operating Environment Page 11<br />
Strategic Business Plan for Sewerage
Page 12 Part A - Operating Environment <strong>Mid</strong>-<strong>Western</strong> <strong>Regional</strong> <strong>Council</strong><br />
Strategic Business Plan for Sewerage
Sewerage Scheme<br />
This section describes the main components of the existing<br />
sewerage schemes, and the plans for their future development.<br />
Existing Sewerage Scheme<br />
<strong>Mid</strong>-<strong>Western</strong> <strong>Regional</strong> <strong>Council</strong> has a sewerage area of 1860 Ha with a population of<br />
13,100 covering the townships of Mudgee, Gulgong, Rylstone and Kandos. Villages are<br />
serviced by septic tanks. <strong>Council</strong> is currently investigating feasibility of reticulated<br />
sewerage for the villages of Clandulla and Charbon.<br />
<strong>Council</strong> operates and maintains 174 Km of reticulation network, 12 pumping stations and<br />
10 Km of rising mains. The treatment system comprises four sewage treatment plants one<br />
each for the townships serviced with a total capacity of 16,750 EP.<br />
<strong>Council</strong> has entered into a Load Reduction Agreement and associated Pollution<br />
Reduction Program with the Department of Environment and Climate Change (DECC).<br />
Mudgee Scheme<br />
Mudgee’s reticulated sewerage comprises gravity collection system with 5 sewage<br />
pumping stations. The trickling filter based sewage treatment plant is of 8,000 EP<br />
capacity. <strong>Council</strong> is in the process of upgrading the Mudgee STP with continuous<br />
extended aeration and biological nutrient removal processes (IDEA process) in order to<br />
prevent nutrient rich treated effluent discharged to the Cudgegong River.<br />
Gulgong Scheme<br />
The gravity sewage collection system of Gulgong comprises 3 sewage pumping stations<br />
with continuous extended aeration and biological nutrient removal processes (IDEA plant)<br />
adopted for treatment of collected town sewage.<br />
Treated effluent from the Gulgong treatment facility is fully reused for irrigation of lucerne<br />
and other agricultural crops around the site.<br />
Rylstone Scheme<br />
The Rylstone scheme comprises gravity sewage collection system with 2 sewage<br />
pumping stations. The STP comprises primary clarifier, secondary trickling filter and<br />
tertiary lagoon treatment before discharging to the Cudgegong River.<br />
Kandos Scheme<br />
Kandos town also has a gravity sewage collection system with 2 sewage pumping<br />
stations. Configuration of Kandos STP is same as that of Rylstone but with larger<br />
capacities. <strong>Council</strong> plans to decommission these STP’s to replace with a single advanced<br />
STP that will service both these towns.<br />
<strong>Mid</strong>-<strong>Western</strong> <strong>Regional</strong> <strong>Council</strong> Part A - Operating Environment Page 13<br />
Strategic Business Plan for Sewerage
Assets Summary<br />
<strong>Mid</strong>-<strong>Western</strong> <strong>Regional</strong> <strong>Council</strong> has prepared an Asset Register and the locations of all<br />
major assets have been recorded. <strong>Council</strong> is currently installing asset management<br />
software to assist in managing the infrastructure.<br />
<strong>Council</strong> has commenced a program of (CCTV) auditing the condition of underground<br />
assets, but has considerable amount of asset yet to review. At this stage it must be<br />
assumed that there is a growing liability that will have to be met at some point in time and<br />
the level of cost is indicated by the accumulated depreciation less cumulative replacement<br />
expenditure.<br />
The condition of <strong>Council</strong>’s major sewerage assets is presented in the following Table.<br />
Asset<br />
No./ Capacity/<br />
Length<br />
Year of<br />
Construction<br />
Condition<br />
1 – Poor<br />
10– Perfect<br />
Pump Stations<br />
−<br />
Mudgee<br />
5<br />
1971-2004<br />
6<br />
−<br />
Gulgong<br />
3<br />
1965-1969<br />
7<br />
−<br />
Rylstone<br />
2<br />
1971<br />
8<br />
−<br />
Kandos<br />
2<br />
1972<br />
7<br />
Gravity and Rising<br />
Mains<br />
−<br />
−<br />
−<br />
−<br />
Mudgee<br />
Gulgong<br />
Rylstone<br />
Kandos<br />
123 Km<br />
31 Km<br />
11 Km<br />
28 Km<br />
1930-2008<br />
1970-2008<br />
1971-2005<br />
1971-2007<br />
6<br />
6<br />
5<br />
5<br />
STPs<br />
−<br />
Mudgee<br />
8000 EP<br />
1930<br />
4<br />
−<br />
Gulgong<br />
<strong>3000</strong> EP<br />
1997<br />
8<br />
−<br />
Rylstone<br />
2000 EP<br />
1971<br />
5<br />
−<br />
Kandos<br />
2600 EP<br />
1972<br />
5<br />
Page 14 Part A - Operating Environment <strong>Mid</strong>-<strong>Western</strong> <strong>Regional</strong> <strong>Council</strong><br />
Strategic Business Plan for Sewerage
Figure 1 - Map of <strong>Mid</strong>-<strong>Western</strong> <strong>Regional</strong> <strong>Council</strong><br />
COBBORA<br />
DUNEDOO<br />
LEADVILLE<br />
CRABOON<br />
UARBRY<br />
CASSILIS<br />
BORAMBIL<br />
BIRRIWA<br />
TURILL<br />
BOW<br />
ME<br />
TALLAWANG<br />
ULAN<br />
GOOLMA<br />
SPICERS CREEK<br />
GULGONG<br />
COOKS GAP<br />
HOME RULE<br />
WOLLAR<br />
BYLONG<br />
HORTO<br />
KERRABE<br />
COOYAL<br />
TWELVE MILE<br />
WATERLOO<br />
GOAT ISLAND<br />
YARRABIN<br />
EURUNDEREE<br />
BUCKAROO<br />
MUDGEE<br />
MOUNT KNOWLES<br />
WID<br />
GRATTAI<br />
MULLAMUDDY<br />
LUE<br />
APPLE TREE FLAT<br />
WINDEYER<br />
HARGRAVES<br />
BOCOBLE<br />
CUDGEGONG<br />
RYLSTONE<br />
KANDOS<br />
OLINDA<br />
PYRAMUL<br />
CHARBON<br />
CLANDULLA<br />
CRUDINE WARRANGUNIA<br />
ILFORD<br />
TAMBAROORA<br />
SALLYS FLAT<br />
BROGANS CREEK<br />
HILL END<br />
RUNNING STREAM<br />
GLEN ALICE<br />
SOFALA<br />
TURONDALE<br />
OPHIR<br />
BRUINBUN<br />
WATTLE FLAT<br />
MOUNT WYAGDON<br />
CAPERTEE<br />
PALMERS OAKY<br />
BEN BULLEN<br />
GLEN DAVIS<br />
NEWNES<br />
CLIFTON GROVE<br />
LEWIS PONDS<br />
LIMEKILNS<br />
DURAMANA<br />
DARK CORNER<br />
CULLEN BULLEN<br />
NORTH<br />
<strong>Mid</strong>-<strong>Western</strong> <strong>Regional</strong> <strong>Council</strong> Part A - Operating Environment Page 15<br />
Strategic Business Plan for Sewerage
Figure 2 – Map of Mudgee Sewerage Service Area<br />
Page 16 Part A - Operating Environment <strong>Mid</strong>-<strong>Western</strong> <strong>Regional</strong> <strong>Council</strong><br />
Strategic Business Plan for Sewerage
Figure 3 – Map of Gulgong Sewerage Service Area<br />
<strong>Mid</strong>-<strong>Western</strong> <strong>Regional</strong> <strong>Council</strong> Part A - Operating Environment Page 17<br />
Strategic Business Plan for Sewerage
Figure 4 – Map of Rylstone Sewerage Service Area<br />
Page 18 Part A - Operating Environment <strong>Mid</strong>-<strong>Western</strong> <strong>Regional</strong> <strong>Council</strong><br />
Strategic Business Plan for Sewerage
Figure 5 – Map of Kandos Sewerage Service Area<br />
<strong>Mid</strong>-<strong>Western</strong> <strong>Regional</strong> <strong>Council</strong> Part A - Operating Environment Page 19<br />
Strategic Business Plan for Sewerage
Future Development<br />
Growth Projections<br />
<strong>Mid</strong>-<strong>Western</strong> <strong>Regional</strong> <strong>Council</strong> area has had a robust growth in population for a major part<br />
of the 7-year period between 1996 and 2003 at a compounding growth rate of 0.6% p.a.<br />
(Source: ABS, Estimated Residential Population Local <strong>Government</strong> Areas – <strong>NSW</strong> 1991 –<br />
2001, ref 3218.0).<br />
The ABS Census data and the <strong>NSW</strong> Planning forecasts are shown graphically in the<br />
Figure below. Both these forecasts indicate increasing population growth for the Shire.<br />
<strong>Council</strong> has undertaken a review of population projections (2005-2031) in 2005 and has<br />
adopted a long-term average growth rate of 2.2% p.a. for future planning. <strong>Council</strong> is<br />
optimistic with its predictions believing that the economic development strategies it has in<br />
place should result in expected growth in population over the next thirty years. This growth<br />
rate has been adopted in this Strategic Business Plan and for financial modelling for the<br />
financial projections during the 30-year forecast period.<br />
Figure 6 – <strong>Mid</strong>-<strong>Western</strong> <strong>Regional</strong> <strong>Council</strong> Population Growth Projections<br />
The projected number of sewerage assessments for financial modelling purposes is<br />
based on the 6,127 (Residential: 5,573; Non-residential: 554) assessments in June 2006<br />
(Reference: <strong>Mid</strong>-<strong>Western</strong> <strong>Regional</strong> <strong>Council</strong> Audited Financial Statements, Special<br />
Schedule 5 for the year 2005/06) and factored up on a pro-rata basis in line with the<br />
above forecasts.<br />
Page 20 Part A - Operating Environment <strong>Mid</strong>-<strong>Western</strong> <strong>Regional</strong> <strong>Council</strong><br />
Strategic Business Plan for Sewerage
Capital Works Program<br />
The following is a summary of the major sewerage capital works planned for MWRC over<br />
the next 10 years. The justification for why they have been planned is also shown below<br />
Proposed Capital Work Year Justification<br />
Mudgee STP Augmentation 2009 -11 Growth related<br />
Rylstone/Kandos STP 20010 -12 Improved environmental outcomes<br />
Clandulla/Charbon Sewerage<br />
Scheme<br />
2010-12 Improved environmental outcomes<br />
Improved levels of service<br />
Gulgong STP Augmentation 2013 Improved levels of service<br />
Reticulation mains replacement 2008<br />
onwards<br />
Renewal/ Replacement<br />
Telemetry upgrade 2008 -13 Improved levels of service<br />
Stakeholders<br />
Stakeholders are parties within <strong>Mid</strong>-<strong>Western</strong> Region who have an interest in the sewerage<br />
schemes and its operation. The expectations of the stakeholders have a significant<br />
impact on the development and operation of the schemes. Internal stakeholders include:<br />
Residents/Families Property Owners/Ratepayers<br />
<strong>Council</strong>lors Pensioners<br />
<br />
Commercial and Industrial<br />
Consumers<br />
<br />
<strong>Council</strong> Employees<br />
Technical Management Staff Tourists<br />
<strong>Government</strong> Agencies Special Interest Groups<br />
A review of stakeholder satisfaction to identify any perceived service gaps is presented in<br />
Appendix C.<br />
<strong>Mid</strong>-<strong>Western</strong> <strong>Regional</strong> <strong>Council</strong> Part A - Operating Environment Page 21<br />
Strategic Business Plan for Sewerage
Page 22 Part A - Operating Environment <strong>Mid</strong>-<strong>Western</strong> <strong>Regional</strong> <strong>Council</strong><br />
Strategic Business Plan for Sewerage
Levels of Service<br />
Define explicitly the standards required from sewerage scheme and<br />
are an extension of <strong>Council</strong>’s corporate objectives<br />
The Levels of Service:<br />
• define explicitly the standards required from the sewerage system;<br />
• are an expansion of the mission statement; and<br />
• will largely shape <strong>Council</strong>'s detailed planning.<br />
The Levels of Service define the deliverables and are the driving force for the sewerage<br />
schemes’ management and development. Achieving the target Levels of Service is the<br />
PRIMARY GOAL.<br />
While minimum standards in some areas such as effluent quality, noise, odour, effluent<br />
discharge and sludge management are covered by statutory and license requirements,<br />
the community may desire levels of service that are more stringent than the regulatory<br />
requirements. These levels of service may be seen as reflecting local community<br />
aspirations. There are also operational levels of service relating to service reliability,<br />
responsiveness to complaints, etc, which are not covered by regulation.<br />
The current and target levels of service, which the <strong>Council</strong> aims to achieve, are shown<br />
overleaf. As <strong>Council</strong> and customers are satisfied with the current Levels of Service<br />
provided, the majority of the target levels of service remains unchanged.<br />
It should be noted that while the current Levels of Service are the target, which <strong>Council</strong><br />
aims to meet, they are not intended as a formal customer contract at this stage. Rather<br />
<strong>Council</strong>’s responsibility is to achieve these levels and then to achieve them more cost<br />
effectively through a process of continual improvement.<br />
<strong>Mid</strong>-<strong>Western</strong> <strong>Regional</strong> <strong>Council</strong> Part A - Operating Environment Page 23<br />
Strategic Business Plan for Sewerage
Levels of Service – Sewerage<br />
DESCRIPTION<br />
UNIT<br />
LEVEL OF SERVICE<br />
Current Target (2012)<br />
Availability of Service<br />
− Extent of area serviced % Designated<br />
Service area<br />
100% Urban areas<br />
of Mudgee,<br />
Gulgong, Rylstone<br />
and Kandos<br />
100% of Urban<br />
areas of Mudgee,<br />
Gulgong, Rylstone,<br />
Kandos, Clandulla<br />
and Charbon<br />
System Failures<br />
Category One:<br />
−<br />
Failure due to rainfall and deficient<br />
capacity (overflows)<br />
Category Two:<br />
−<br />
Failures due to pump or other<br />
breakdown including power failure<br />
Category Three:<br />
−<br />
Failures due to main blockages and<br />
collapses<br />
No./year 10 4<br />
No./ year<br />
6 due to<br />
maintenance<br />
12 due to power<br />
failure<br />
6 due to<br />
maintenance<br />
12 due to power<br />
failure (standby<br />
pumps provided)<br />
No./ year 300 250<br />
Response Times for System Failures<br />
(Defined as the maximum time to have<br />
staff on site to commence rectification<br />
after notification)<br />
Priority One:(Major spill, significant<br />
environmental or health impact, or<br />
affecting large number of consumers ie<br />
a major main)<br />
−<br />
During working hours:<br />
Hours<br />
0.5<br />
0.5<br />
−<br />
During after hours:<br />
Hours<br />
1<br />
1<br />
Priority Two:(Moderate spill, some<br />
environmental or health impact, or<br />
affecting small number of consumers ie<br />
other mains)<br />
−<br />
During working hours:<br />
Hours<br />
1<br />
1<br />
−<br />
During after hours:<br />
Hours<br />
1<br />
1<br />
Priority Three:(Minor spill, little<br />
environmental or health impact, or<br />
affecting a couple of consumers)<br />
Working Day 1 1<br />
Page 24 Part A - Operating Environment <strong>Mid</strong>-<strong>Western</strong> <strong>Regional</strong> <strong>Council</strong><br />
Strategic Business Plan for Sewerage
DESCRIPTION<br />
UNIT<br />
LEVEL OF SERVICE<br />
Current Target (2012)<br />
Response Times for Complaints<br />
General Complaints and Inquiries:<br />
−<br />
−<br />
Written complaints<br />
Personal/Oral complaints<br />
Note: Times apply for 95% of<br />
occasionss<br />
Odour Complaints:<br />
−<br />
−<br />
−<br />
Treatment works (outside<br />
designated buffer zone)<br />
Pumping Stations<br />
Reticulation system<br />
Effluent Discharge and Sludge<br />
Management<br />
Failure to meet licence limits and<br />
statutory requirements (100 percentile)<br />
Working days<br />
Working days<br />
20<br />
1<br />
10<br />
1<br />
No. /year<br />
2<br />
0<br />
No. /year<br />
0<br />
0<br />
No./year<br />
0<br />
0<br />
% 75 0<br />
Discharge Licence Conditions<br />
Discharge Site<br />
River and Land<br />
River and Land<br />
Effluent Reuse<br />
%<br />
5<br />
25<br />
Biochemical Oxygen Demand<br />
mg/L<br />
30<br />
10<br />
Total Suspended Solids<br />
mg/L<br />
30<br />
10<br />
Total Nitrogen<br />
mg/L<br />
20<br />
7<br />
Oil and Grease<br />
mg/L<br />
10<br />
2<br />
Total Phosphorus<br />
mg/L<br />
2 (Mudgee)<br />
0.3 (Mudgee)<br />
Note: The Levels of Service are the targets, which <strong>Council</strong> aims to meet; they are not<br />
intended as a formal customer contract.<br />
<strong>Mid</strong>-<strong>Western</strong> <strong>Regional</strong> <strong>Council</strong> Part A - Operating Environment Page 25<br />
Strategic Business Plan for Sewerage
Page 26 Part A - Operating Environment <strong>Mid</strong>-<strong>Western</strong> <strong>Regional</strong> <strong>Council</strong><br />
Strategic Business Plan for Sewerage
Principal Issues<br />
Looks at the key concerns facing <strong>Council</strong> in the future<br />
A number of issues have been identified as important to the future operation of the<br />
sewerage schemes. Below is a list of these issues and where they have been addressed<br />
in this Strategic Business Plan.<br />
Issue<br />
Meeting DWE Best Practice Management<br />
Guidelines and other government<br />
regulations<br />
Augmenting STPs to meet conditions of<br />
Load Reduction Agreement with DECC<br />
Establishing priorities for extension of<br />
service areas<br />
Equitable service pricing including<br />
developer charges across the Region<br />
Developing asset management system<br />
including maintaining real-time asset<br />
condition data/ details<br />
Managing and funding long-term capital<br />
works program<br />
Section where this is addressed<br />
Objective 1 – Levels of Service Review<br />
Objective 4 – Service Pricing<br />
Objective 7 – Environment<br />
Objective 3 – Sewer Load Management<br />
Objective 7 - Environment<br />
Objective 10 – Capital Works<br />
Objective 2 – Areas Serviced<br />
Objective 4 – Service Pricing<br />
Objective 10 – Capital Works<br />
Objective 8 – Operations<br />
Objective 9 - Maintenance<br />
Objective 10 – Capital Works<br />
Objective 12 – Finance<br />
<strong>Mid</strong>-<strong>Western</strong> <strong>Regional</strong> <strong>Council</strong> Part A - Operating Environment Page 27<br />
Strategic Business Plan for Sewerage
Page 28 Part A - Operating Environment <strong>Mid</strong>-<strong>Western</strong> <strong>Regional</strong> <strong>Council</strong><br />
Strategic Business Plan for Sewerage
Best Practice Management<br />
Department of Energy, Utilities and Sustainability Best Practice Guidelines<br />
The Department of Water and Energy (DWE) has prepared Guidelines for Best-Practice of<br />
Water Supply and Sewerage pursuant to section 409(6) of the Local <strong>Government</strong> Act<br />
1993. A summary of <strong>Mid</strong>-<strong>Western</strong> <strong>Regional</strong> <strong>Council</strong>’s compliance status of the criteria is<br />
as follows:<br />
Issue<br />
Strategic Business Plan<br />
(including Financial Plan)<br />
Sewerage and Trade<br />
Waste Pricing<br />
Liquid Trade Waste<br />
Management<br />
Developer Charges<br />
Annual Performance<br />
Reporting<br />
Asset Management*<br />
Environmental<br />
Management*<br />
Integrated Water Cycle<br />
Management<br />
Status<br />
This document represents the Strategic Business Plan and<br />
Financial Plan.<br />
<strong>Council</strong> has ad-valorem sewerage rates as well as minimum<br />
rates. Best Practice Pricing issues including two-part sewerage<br />
tariffs and liquid trade waste fees and charges for nonresidential<br />
customers as in the DWE Sewerage and Trade<br />
Waste Pricing Checklist will be addressed by June 2009.<br />
Liquid trade waste approvals will be issued to each liquid trade<br />
waste discharger connected to the sewerage system and the<br />
issues in the DWE Trade Waste Check List addressed by<br />
December 2008.<br />
Development Servicing Plan with commercial developer<br />
charges will be reviewed and adopted in July 2008.<br />
Performance Reporting Forms are completed annually and<br />
issues in the DWE Performance Reporting Check List have<br />
been addressed.<br />
A 30-year Capital Works Plan, listing the proposed projects for<br />
each of backlog, growth and renewals will be in place by June<br />
2009; the Operations Plan and Maintenance Plan will be<br />
reviewed and updated by June 2009.<br />
The Protection of the Environment Operation Act, 1997 has<br />
been complied with and all issues in the Environmental<br />
Management Checklist addressed in December 2006.<br />
Substantial commencement of sound IWCM by March 2008.<br />
Integrated Water Cycle Management will be fully implemented<br />
and all of the issues in the IWCM Check List addressed by<br />
December 2008.<br />
* - Currently no specific requirements in the DEUS Best Practice Guidelines<br />
<strong>Mid</strong>-<strong>Western</strong> <strong>Regional</strong> <strong>Council</strong> Part A - Operating Environment Page 29<br />
Strategic Business Plan for Sewerage
Page 30 Part A - Operating Environment <strong>Mid</strong>-<strong>Western</strong> <strong>Regional</strong> <strong>Council</strong><br />
Strategic Business Plan for Sewerage
PART B:<br />
STRATEGIC PLAN<br />
Part B of the Plan provides a detailed<br />
description of Service Provision<br />
Objectives, Strategies, Performance<br />
Measures and Actions in the key result<br />
areas in which <strong>Council</strong> must perform<br />
successfully to fulfil its corporate objective<br />
for sewerage.<br />
<strong>Council</strong> has developed five key result areas<br />
in Service Provision Strategies covering:<br />
<br />
<br />
<br />
<br />
<br />
Customer Service<br />
Environment<br />
Asset Management<br />
Human Resources<br />
Finance<br />
Part C contains a more detailed<br />
examination of selected service provision<br />
areas.<br />
<strong>Mid</strong>-<strong>Western</strong> <strong>Regional</strong> <strong>Council</strong> Part B - Strategic Plan Page 31<br />
Strategic Business Plan for Sewerage
Page 32 Part B - Strategic Plan <strong>Mid</strong>-<strong>Western</strong> <strong>Regional</strong> <strong>Council</strong><br />
Strategic Business Plan for Sewerage
Planning Strategy<br />
The relationship between ‘Service Solutions’ and ‘Asset Strategy Planning’ can be<br />
represented as follows:<br />
The progression from ‘Identifying Service Goals’ to ‘Achieving Service Goals’ is<br />
summarised as follows:<br />
SERVICE SOLUTIONS<br />
Objective (Goal)<br />
Performance Targets<br />
Identifying Service Goals<br />
Defines how key result areas contribute to service goals<br />
Expected Outcomes<br />
IMPLEMENTATION<br />
Strategies<br />
Actions<br />
Responsibility<br />
Cost<br />
Achieving Service Goals<br />
The plan for achieving the objective(s)<br />
Specific tasks to implement strategies and achieve<br />
objective(s)<br />
Person in charge of task completion<br />
Implementation (Implement) – One off cost<br />
Ongoing – Cost incurred annually over a number of<br />
years or at regular intervals<br />
<strong>Mid</strong>-<strong>Western</strong> <strong>Regional</strong> <strong>Council</strong> Part B - Strategic Plan Page 33<br />
Strategic Business Plan for Sewerage
Service Planning<br />
There is a relationship between the Levels of Service (LOS) to be provided to consumers<br />
and the actions that will be undertaken by <strong>Council</strong>. The following table shows the<br />
relationship between each of the objectives and related Levels of Service. As such, it<br />
would be expected that any changes to current LOS would be addressed in the indicated<br />
objectives.<br />
This table is a summary of how the Levels of Service map into the key result area actionplanning<br />
framework.<br />
OBJECTIVES<br />
Service Management<br />
Area Serviced<br />
Sewer Load Management<br />
Pricing<br />
Customer Relations<br />
Community Consultation<br />
Environment<br />
Operations<br />
Maintenance<br />
Capital Works<br />
Human Resources<br />
Financial<br />
LEVEL OF SERVICE<br />
Sustainability<br />
Availability of Service<br />
Discharge – Trade Wastes<br />
Failures (Inflow/ Infiltration)<br />
Availability – user pays<br />
Rebates – pensioners<br />
Availability of Service<br />
Service requests<br />
Complaints/Enquiries<br />
Service pricing<br />
Environment<br />
Overflows<br />
Sewage treatment<br />
Effluent disposal standards - compliance<br />
Failure – blockages<br />
Response times<br />
Failure - breakdowns<br />
Availability – capacity<br />
Failure – design<br />
Failure – replacement program<br />
Effluent disposal – compliance<br />
Complaints/ Enquiries<br />
Response Times<br />
Affordability - model<br />
Page 34 Part B - Strategic Plan <strong>Mid</strong>-<strong>Western</strong> <strong>Regional</strong> <strong>Council</strong><br />
Strategic Business Plan for Sewerage
Abbreviations Used<br />
In addition to the general abbreviations listed in Appendix A, the following abbreviations<br />
have been used in the Action Plans presented in this section of the plan.<br />
BMS<br />
GM<br />
GMA<br />
GMO<br />
GMP<br />
HRUM<br />
MF<br />
HB<br />
MTS<br />
MWCW<br />
NAE<br />
Business Manager Services<br />
General Manager<br />
Group Manager Assets<br />
Group Manager Operations<br />
Group Manager Planning and Development<br />
Human Resources Unit Manager<br />
Manager Finance<br />
Team Leader Health and Building<br />
Manager Technical Support<br />
Manager Water Cycle and Waste<br />
No Additional Expense<br />
<strong>Mid</strong>-<strong>Western</strong> <strong>Regional</strong> <strong>Council</strong> Part B - Strategic Plan Page 35<br />
Strategic Business Plan for Sewerage
Page 36 Part B - Strategic Plan <strong>Mid</strong>-<strong>Western</strong> <strong>Regional</strong> <strong>Council</strong><br />
Strategic Business Plan for Sewerage
Customer Service<br />
This section details <strong>Mid</strong>-<strong>Western</strong> <strong>Regional</strong> <strong>Council</strong>’s<br />
objectives relating to customer service, including<br />
Levels of Service, customer relations, community<br />
involvement, pricing and sewer load management.<br />
The Customer Service Plan covers activities, which involve interaction between <strong>Council</strong>,<br />
its customers and the wider community.<br />
This Section of the Plan covers the following areas:<br />
• The Levels of Service provided to customers;<br />
• Current and future sewerage service areas;<br />
• Sewer load management;<br />
• The pricing of services (including trade waste pricing and developer<br />
charges);<br />
• Customer relations with <strong>Council</strong>; and<br />
• Community consultation initiatives.<br />
<strong>Mid</strong>-<strong>Western</strong> <strong>Regional</strong> <strong>Council</strong> Part B - Strategic Plan Page 37<br />
Strategic Business Plan for Sewerage
Levels of Service Review<br />
The Levels of Service discussed in part A, are designed to reflect an optimisation of the<br />
desired service provision, what is affordable, and the system’s capability. These<br />
considerations take into account legislative requirements, industry standards and<br />
customer demands.<br />
This section reviews the services currently provided by the <strong>Council</strong>’s sewerage schemes.<br />
In addition to identifying areas where improvement is necessary, the review also refers to<br />
aspects of the operation that are being performed well.<br />
The Levels of Service objective should enable the community to be aware of, and endorse<br />
the Levels of Service provided. As a public document, this report provides the necessary<br />
background information.<br />
To demonstrate continuous improvement, <strong>Council</strong> will seek to provide the target Levels of<br />
Service in the most efficient manner. A number of items are of particular importance and<br />
these will be addressed under the relevant key result areas.<br />
Under the DWE Best Practice Management Guidelines, a performance review is required<br />
to demonstrate that <strong>Council</strong> is either achieving the Level of Service or improving towards<br />
achieving the target levels. Monitoring and benchmarking are needed to help <strong>Council</strong><br />
determine if their methods are appropriate or more effective than other local water utilities.<br />
Performance data is forwarded to DWE each year and a TBL report is received back the<br />
following year that should be communicated to <strong>Council</strong> by 31 st August.<br />
A benchmarking exercise needs to be conducted to ensure Levels of Service are<br />
comparable to others in the industry at present. Generally <strong>Council</strong> has been performing<br />
well in respect of the Levels of Service.<br />
<strong>Council</strong> plans following service level improvements in the near future:<br />
• Reducing number of main blockages and associated service requests<br />
• Reducing number of odour complaints from outside the designated buffer<br />
zone due to STPs<br />
Page 38 Part B - Strategic Plan <strong>Mid</strong>-<strong>Western</strong> <strong>Regional</strong> <strong>Council</strong><br />
Strategic Business Plan for Sewerage
Objective 1: Levels of Service Review<br />
Provide services that meet the agreed LOS and are economically feasible and<br />
financially affordable and meet health and environmental requirements<br />
Performance Targets<br />
Compliance with levels of service and action planning and meet performance targets<br />
Strategy<br />
Review current operations and documented levels of service and update the Strategic<br />
Business Plan (SBP)<br />
Objective 1: Actions Start End Responsible<br />
Strategy 1<br />
Cost $000<br />
Implement Ongoing<br />
Review current operations<br />
for annual report<br />
Annually MWCW NAE<br />
Review and update<br />
Strategic Business Plan<br />
Public display of SBP and<br />
adoption by <strong>Council</strong><br />
Implement and monitor<br />
SBP Action Plans<br />
Best Practice Management<br />
Compliance Audit<br />
Monitor and review LOS<br />
targets and report<br />
performance to DEUS<br />
Report key performance<br />
indicators and TBL reports<br />
to <strong>Council</strong><br />
Input and review of special<br />
schedules for Dept. of<br />
Local Govt. in the financial<br />
statements<br />
SoE reporting<br />
2010 5 yearly GMA 20 15 every 5<br />
years<br />
As<br />
required<br />
MWCW<br />
NAE<br />
Ongoing MWCW As detailed in this report<br />
July<br />
2008<br />
Sep<br />
Annually<br />
August<br />
Annually<br />
August<br />
Annually<br />
Nov<br />
Annually<br />
Jun<br />
2009<br />
MWCW 2<br />
MWCW<br />
GMA<br />
MF<br />
GMP<br />
NAE<br />
NAE<br />
NAE<br />
NAE<br />
<strong>Mid</strong>-<strong>Western</strong> <strong>Regional</strong> <strong>Council</strong> Part B - Strategic Plan Page 39<br />
Strategic Business Plan for Sewerage
Areas Serviced<br />
This section of the Customer Service Plan addresses <strong>Council</strong>’s intentions in the provision<br />
of services for the next thirty years.<br />
The extension of sewerage services is dependent on a range of factors, the most<br />
important of which are:<br />
• the growth in urban and rural settlements,<br />
• the environmental impact of the works.<br />
• Cost to ratepayers associated with extending services.<br />
When extending services, <strong>Council</strong> will have to:<br />
• Treat all residents as equal for the provision of services<br />
• Consider residents expectation of service.<br />
• Consult community when considering new development areas or backlog<br />
programs<br />
Rural-small holdings and rural subdivisions (lot sizes greater than 1ha and 10ha<br />
respectively) do not require sewering under current planning requirements. Lot sizes are<br />
considered large enough for the proper operation of septic tanks or aerated treatment<br />
systems and are not considered to pose any health related problems.<br />
Table next page summarises the details of current and future (30-years) sewerage service<br />
areas within the Region. As indicated by the table, <strong>Council</strong> plans to extend sewerage<br />
services to the villages of Charbon and Clandulla in the near future.<br />
With an expected long-term average annual growth rate of 1.7% p.a. in residential<br />
assessments in the service areas covered by existing sewerage schemes over the next<br />
30 years, and considering capacities of the existing system, it is believed that<br />
augmentation of all the schemes will be required.<br />
Page 40 Part B - Strategic Plan <strong>Mid</strong>-<strong>Western</strong> <strong>Regional</strong> <strong>Council</strong><br />
Strategic Business Plan for Sewerage
Towns<br />
No. of Assessments/ETs<br />
Current<br />
(2007)<br />
Future<br />
(2036)<br />
Current<br />
Service Type<br />
Future<br />
Birriwa 17 Septic System Septic System<br />
Bylong 10 Septic System Septic System<br />
Charbon 73 130 Septic System Reticulated<br />
Sewerage<br />
Clandulla 121 215 Septic System Reticulated<br />
Sewerage<br />
Goolma 20 Septic System Septic System<br />
Gulgong 870 1100 Reticulated<br />
Sewerage<br />
Reticulated<br />
Sewerage<br />
Hargraves 62 Septic System Septic System<br />
Ilford 53 Septic System Septic System<br />
Kandos 680 700 Reticulated<br />
Sewerage<br />
Reticulated<br />
Sewerage<br />
Lue 45 Septic System Septic System<br />
Mudgee 3890 6220 Reticulated<br />
Sewerage<br />
Reticulated<br />
Sewerage<br />
Pyramul 35 Septic System Septic System<br />
Running Stream 3 Septic System Septic System<br />
Rylstone 330 440 Reticulated<br />
Sewerage<br />
Reticulated<br />
Sewerage<br />
Turill 10 Septic System Septic System<br />
Ulan 66 Septic System Septic System<br />
Windeyer 45 Septic System Septic System<br />
Wollar 103 Septic System Septic System<br />
Note: The number of assessments is the estimated number of available yield within the<br />
village/town only and not the total number of assessments within the locality, based upon<br />
best available information.<br />
<strong>Mid</strong>-<strong>Western</strong> <strong>Regional</strong> <strong>Council</strong> Part B - Strategic Plan Page 41<br />
Strategic Business Plan for Sewerage
Objective 2: Areas Serviced<br />
To provide services to existing areas at current levels and extend to new residential<br />
and industrial areas on a user pays basis<br />
Performance Targets<br />
Provide service in advance of demand where economically viable<br />
Review and update Development Servicing Plans (DSP) by June 2008<br />
Strategies<br />
Review need and identify works required to provide/extend services in accordance<br />
with LEP identified growth areas<br />
Objective 2: Actions Start End Responsible<br />
Strategy 1<br />
Cost $000<br />
Implement Ongoing<br />
Development of<br />
comprehensive LEP to<br />
identify future growth areas<br />
Jan 2007<br />
June<br />
2008<br />
GMP<br />
NAE<br />
Sewer Modelling<br />
March<br />
2008<br />
Dec<br />
2008<br />
MWCW Refer to Objective 10:<br />
Operations<br />
Prepare Development<br />
Servicing Plan<br />
June<br />
2007<br />
June<br />
2008<br />
MWCW<br />
Review Section 64 charges<br />
for identified future growth<br />
areas<br />
Dec<br />
2007<br />
June<br />
2008<br />
MWCW 5<br />
Page 42 Part B - Strategic Plan <strong>Mid</strong>-<strong>Western</strong> <strong>Regional</strong> <strong>Council</strong><br />
Strategic Business Plan for Sewerage
Sewer Load Management<br />
This section of the Plan outlines <strong>Council</strong>'s intention in the management of loadings on the<br />
sewerage systems. While the impacts and management practices are of concern to the<br />
Customer Service Plan, the solutions must be an integrated part of the Asset<br />
Management Plan since they involve long-term system maintenance strategies.<br />
Reducing hydraulic and biochemical loading on the system can:<br />
• Effectively prolong the life of the existing assets;<br />
• Defer new works programs;<br />
• Make treatment processes more effective<br />
• Reduce siltation in the system and reduce pump wear;<br />
• Reduce operation costs; and<br />
• Improve environmental performance.<br />
Problems of load management may occur due to changing development patterns affecting<br />
design capacity, trade waste discharges, stormwater, or ground water.<br />
Inflow and Infiltration Management<br />
Although water demand management can reduce the hydraulic load on the treatment<br />
works, the major factor is usually the ingress of water into the system. The challenge is to<br />
control and reduce any significant inflow and infiltration (I/I).<br />
Inflow, by definition, is due to direct ingress from illegal connections of roof drains, back<br />
yards and low gullies, manhole covers, surface water drain connections etc.<br />
Infiltration, by definition, is a result of damage to the sewers themselves due to cracking,<br />
breakage, open joints and broken junctions etc. Infiltration can occur in dry weather as<br />
well as wet weather if the pipes are below the water table, or adjacent to a streambed<br />
(refer to Sewerage inflow and infiltration management study, June 1996 issued to all<br />
<strong>Council</strong>s by DWE).<br />
<strong>Council</strong> plans to address the following main issues in this regard:<br />
• Wet weather infiltration caused by combination of illegal connections,<br />
defective pipes and defective manholes/ access chambers<br />
• Updating trade waste register and trade waste policy to manage sewer<br />
overloading and odour problems at the STP<br />
<strong>Mid</strong>-<strong>Western</strong> <strong>Regional</strong> <strong>Council</strong> Part B - Strategic Plan Page 43<br />
Strategic Business Plan for Sewerage
Trade Waste Management<br />
The treatment system functions can also be jeopardised by high biological shocks or toxic<br />
chemical loading exerted by liquid trade wastes. Therefore, the <strong>Council</strong> needs to assess<br />
the current levels of liquid trade waste discharges by non-residential customers into the<br />
town sewer system.<br />
<strong>Council</strong> already follows the DWE concurrence guidelines for Trade waste approvals, but is<br />
yet to formally adopt a trade waste policy and implement charges as recommended by the<br />
guidelines. <strong>Council</strong> is planning to prepare a trade waste register and to implement the<br />
adopted trade waste pricing policy in line with the DWE recommendations from July 2009<br />
onwards.<br />
Page 44 Part B - Strategic Plan <strong>Mid</strong>-<strong>Western</strong> <strong>Regional</strong> <strong>Council</strong><br />
Strategic Business Plan for Sewerage
Objective 3: Sewer Load Management<br />
Operate the sewerage system in an efficient and environmentally sound manner and<br />
reduce wet weather hydraulic sewerage loading to its economic limit and manage<br />
industrial and commercial biological load in accordance with DWE Trade Waste<br />
guidelines<br />
Performance Target<br />
Achieve peak wet weather flow of less than five times average dry weather flow by 2018<br />
Implement Trade Waste Policy from July 2009<br />
Strategies<br />
Implement infiltration / inflow (I/I) strategies as identified in I/I Investigation report<br />
Develop and Implement Trade Waste Policy<br />
Objective 3: Actions Start End Responsible<br />
Strategy 1<br />
Cost $000<br />
Implement Ongoing<br />
Complete sewer reticulation<br />
modelling<br />
Develop Strategic Asset<br />
Management Plan<br />
Flow monitoring analysis and<br />
inspections<br />
Smoke testing and rectification<br />
of defects<br />
Implement sewer/manhole<br />
maintenance program<br />
July<br />
2008<br />
July<br />
2008<br />
July<br />
2008<br />
Dec<br />
2008<br />
June<br />
2009<br />
MWCW 80<br />
MWCW Refer to Objective 11:<br />
Capital Works<br />
Ongoing MWCW NAE<br />
Ongoing MWCW 10<br />
Ongoing BMS NAE<br />
CCTV inspections Ongoing MWCW 40<br />
Replacement / repairs to<br />
sewers<br />
Ongoing MWCW Refer to Objective 10:<br />
Capital works<br />
Contd…/<br />
<strong>Mid</strong>-<strong>Western</strong> <strong>Regional</strong> <strong>Council</strong> Part B - Strategic Plan Page 45<br />
Strategic Business Plan for Sewerage
Objective 3: Actions Start End Responsible<br />
Strategy 2<br />
Cost $000<br />
Implement Ongoing<br />
Establish register and scope of<br />
discharge<br />
Public awareness program<br />
Develop and adopt policy and<br />
system of trade waste charges<br />
in accordance with DEUS<br />
guidelines<br />
Enter into agreements with<br />
trade waste dischargers<br />
Implement policy:<br />
−<br />
−<br />
−<br />
Reporting<br />
Produce notices<br />
Compliance monitoring<br />
Started<br />
July<br />
2008<br />
July<br />
2008<br />
January<br />
2009<br />
July<br />
2009<br />
July<br />
2008<br />
Dec<br />
2008<br />
Dec<br />
2008<br />
July<br />
2009<br />
MWCW<br />
NAE<br />
MWCW 5<br />
MWCW<br />
MWCW<br />
NAE<br />
NAE<br />
Ongoing MWCW 10<br />
Page 46 Part B - Strategic Plan <strong>Mid</strong>-<strong>Western</strong> <strong>Regional</strong> <strong>Council</strong><br />
Strategic Business Plan for Sewerage
Service Pricing<br />
This section of the Plan outlines <strong>Council</strong>'s intentions regarding the pricing of sewerage<br />
services.<br />
<strong>Council</strong>'s pricing policy should conform to the following general principles:<br />
Equity - adoption of user pays principles in accordance with the August 2007 DWE<br />
Guidelines. Residential tariff to be a fixed charge and non-residential revenue to be<br />
collected via a two-part tariff which reflects the level of water used and hence the load on<br />
the sewer system through discharge. (It is considered equitable that people pay for the<br />
cost of the services they use).<br />
Financial - provision of adequate cash flows to meet operating costs and to fund future<br />
capital works (as determined in the financial plans).<br />
Customers - provision of a service of desired quality and reliability at a fair and affordable<br />
price.<br />
Cross subsidies - should be fully disclosed in <strong>Council</strong>’s reporting.<br />
Community service obligations - provision of services to pensioners, disadvantaged<br />
groups and general community amenities, to be recognised.<br />
Other - simplicity of pricing structure for ease of understanding by customers and stability<br />
of income.<br />
Sewerage Tariff structure<br />
<strong>Council</strong> still has ad valorem sewerage tariff based on land value and a minimum<br />
sewerage availability charge for both residential and non-residential customers. Annual<br />
minimum sewerage availability charges for 2006/07 was $433 p. a and the charges for<br />
2007/08 was $447 p.a.<br />
<strong>Council</strong> plans to review sewerage tariff structure in accordance with DWE Best Practice<br />
Guidelines by March 2009 and complete implementation of the same in a phased manner<br />
from July 2009. This will allow <strong>Council</strong> to comply with the recommendations of IPART and<br />
DWE. <strong>Council</strong> will be adopting a “user pays” system with features such as:<br />
• Access / availability charge for non-residential assessment;<br />
• Trade waste charges set for identified industries; and<br />
• Percentage charge of water consumed reassessed for exceptional<br />
circumstances businesses e.g. a nursery, where most water is consumed<br />
on water plants.<br />
<strong>Mid</strong>-<strong>Western</strong> <strong>Regional</strong> <strong>Council</strong> Part B - Strategic Plan Page 47<br />
Strategic Business Plan for Sewerage
Developer Charges<br />
Developer Charges are up-front charges levied under Section 64 of the Local <strong>Government</strong><br />
Act to recover part of the infrastructure costs incurred in servicing new developments or<br />
additions/changes to existing developments. Developer charges serve two related<br />
functions:<br />
• They provide a source of funding for infrastructure required for new urban<br />
development.<br />
• They impact on the costs of urban development and thus encourage less<br />
costly forms and areas of development.<br />
<strong>Council</strong> levies following rates of Section 64 developer charges:<br />
Town<br />
Section 64 Charges / ET<br />
(2008/09)<br />
Mudgee<br />
Gulgong<br />
Rylstone<br />
$ 3,198<br />
$ 3,198<br />
$ 3,198<br />
<strong>Council</strong> has recently reviewed the developer contribution under Section 64 of the Local<br />
<strong>Government</strong> Act and will adopt commercial developer charges in accordance with DWE<br />
Best Practice Guidelines from July 2008 onwards.<br />
Page 48 Part B - Strategic Plan <strong>Mid</strong>-<strong>Western</strong> <strong>Regional</strong> <strong>Council</strong><br />
Strategic Business Plan for Sewerage
Objective 4: Service Pricing<br />
An equitable pricing policy that supports current and future service provision based on<br />
full cost recovery and user pays basis and maximise revenue from grants and other<br />
sources<br />
Performance Target<br />
Full implementation of developer charges from July 2008<br />
Phased implementation of best practice pricing from July 2009<br />
Strategies<br />
Sewerage charges reviewed every 3-5 years to meet financial planning revenue goals<br />
Review of developer contributions<br />
Objective 4: Actions Start End Responsible<br />
Strategy 1<br />
Cost $000<br />
Implement Ongoing<br />
Review levels of revenue<br />
from charges<br />
Adjust and adopt tariffs to suit<br />
financial model projections<br />
and cross-subsidy policy<br />
Strategy 2<br />
Annually MF NAE<br />
Annually Ongoing MF/GMA NAE<br />
Review and update<br />
developers contribution and<br />
DSP<br />
Started<br />
June<br />
2008<br />
(5 yearly)<br />
Public display of DSP update Every 5<br />
years<br />
MWCW 14 7 /<br />
5years<br />
MWCW<br />
NAE<br />
<strong>Mid</strong>-<strong>Western</strong> <strong>Regional</strong> <strong>Council</strong> Part B - Strategic Plan Page 49<br />
Strategic Business Plan for Sewerage
Customer Relations<br />
This section of the Plan outlines <strong>Council</strong>'s intentions in customer relations to ensure its<br />
customers are satisfied with the sewerage service provided.<br />
In the area of customer relations the aim is to maintain good customer relations through<br />
the provision of a quality service, keeping customers informed of <strong>Council</strong>’s intentions, and<br />
responding to customer and community needs. <strong>Council</strong> believes it operates a service that<br />
is reliable, has good quality water and provides a quick response to problems with the<br />
system.<br />
Customer satisfaction can be measured in a variety of ways to give a valid indication of<br />
the extent to which customers feel satisfied with the type, quality, cost and performance of<br />
service provided. Keeping customers informed is agreed by <strong>Council</strong> to be important for<br />
good customer relationship. Methods employed include:<br />
• <strong>Council</strong>’s Community Newspaper;<br />
• Being responsive to customer needs;<br />
• Town and village forums held throughout the Region;<br />
• Public forums at <strong>Council</strong> meetings;<br />
• <strong>Council</strong> website;<br />
• Published levels of service; and<br />
• Annually report on achievements, performance etc<br />
Adherence to the published Levels of Service is important and advance notification of any<br />
planned failure to comply with the levels of service should be given wherever possible.<br />
Performance monitoring and reporting is very important for updating and review of the<br />
Strategic Business Plan.<br />
In order to carry out <strong>Council</strong>’s mission to focus on the community expectations, a level of<br />
communication is required so that the community is satisfied that the <strong>Council</strong>’s decisions<br />
are responsive to their needs. A complaints record system does exist and <strong>Council</strong> intends<br />
to implement a customer focussed, socially responsive communications system for<br />
service provision issues. The <strong>Council</strong> will record problems and complaints and analyse<br />
them to identify where conditions are deteriorating. Actions will then be taken to improve<br />
these situations.<br />
<strong>Council</strong> has identified the following issues vis a vis customer relations:<br />
• Documenting customer relations procedure<br />
• Annual customer satisfaction survey<br />
Page 50 Part B - Strategic Plan <strong>Mid</strong>-<strong>Western</strong> <strong>Regional</strong> <strong>Council</strong><br />
Strategic Business Plan for Sewerage
Objective 5: Customer Relations<br />
Provide a high level of customer satisfaction with reduced level of substantiated<br />
complaints and keep the customers informed of significant issues<br />
Performance Targets<br />
Implement new customer service request system by September 2008<br />
Conduct annual customer satisfaction survey<br />
Strategies<br />
Continuous improvement of customer service mechanism<br />
Ensure levels of service are met<br />
Objective 5: Actions Start End Responsible<br />
Strategy 1<br />
Cost $000<br />
Implement Ongoing<br />
Implement new customer<br />
request system<br />
July<br />
2007<br />
Sep<br />
2008<br />
MTS<br />
NAE<br />
Document procedures for<br />
receiving customer requests<br />
during working hours and<br />
after hours<br />
July<br />
2008<br />
Sep<br />
2008<br />
MTS<br />
NAE<br />
Customer education Ongoing MWCW 1<br />
Monitor complaint reports Ongoing MWCW NAE<br />
Staff training Ongoing BMS Refer to Objective 11:<br />
Human Resources<br />
Strategy 2<br />
Publish statistical information<br />
in Annual Report<br />
Conduct customer<br />
satisfaction survey<br />
Annually<br />
(Nov)<br />
Annually<br />
(August)<br />
MWCW<br />
NAE<br />
MWCW 3<br />
<strong>Mid</strong>-<strong>Western</strong> <strong>Regional</strong> <strong>Council</strong> Part B - Strategic Plan Page 51<br />
Strategic Business Plan for Sewerage
Community Involvement<br />
This section of the Plan outlines <strong>Council</strong>’s intentions in involving the community in<br />
decision-making during the development of schemes. Community consultation is not only<br />
highly desirable in terms of major capital works, but there are requirements under the<br />
Environmental Planning and Assessment Act and the Local <strong>Government</strong> Act, which need<br />
to be satisfied. The aims of community consultation are to:<br />
• Develop ownership of the service delivery issues by the community, and to<br />
gain agreement that action is required;<br />
• Ensure that the concerns of the community, particularly social and<br />
environmental concerns, are taken into account;<br />
• Allow the community to propose options it wants evaluated and ensure that<br />
the costs associated with decisions are acceptable; and<br />
• Demonstrate to the community that <strong>Council</strong> is making the best decisions<br />
after proper evaluation of all the issues.<br />
Methods used by <strong>Council</strong> to consult the community in the past include:<br />
• Public meetings and village tours;<br />
• Customer Surveys;<br />
• Public forum at <strong>Council</strong> meetings;<br />
• Public display of planning documents;<br />
Development of the Local Environmental Plan, new water supplies and reservoirs and<br />
new sewage treatment works all benefit from direct involvement of the community.<br />
Periods of public display, public comment and notices to ratepayers and business groups<br />
to advertise the opportunity to comment are typical.<br />
Following issues need to be considered when undertaking community consultation:<br />
• Members of community who are not directly affected by a project may also<br />
have concerns;<br />
• There must be a balance between due process and risks in order that a<br />
satisfactory level of progress can be maintained;<br />
• While community consultation on projects is highly desirable, it can be a<br />
lengthy process and project lead times need to be programmed to take<br />
account of this.<br />
While community consultation on projects is necessary and highly desirable, it can be a<br />
lengthy process and project lead times need to be programmed to take account of this.<br />
Page 52 Part B - Strategic Plan <strong>Mid</strong>-<strong>Western</strong> <strong>Regional</strong> <strong>Council</strong><br />
Strategic Business Plan for Sewerage
In future, <strong>Council</strong> intends to maintain the existing methods of consultation for all major<br />
capital works or decisions. Proposed sewerage supply works that would benefit from<br />
community consultation include:<br />
• New sewerage schemes to villages of Charbon and Clandulla<br />
• Implementation of best practice sewerage pricing, liquid trade waste policy<br />
and pricing, developer charges and IWCM strategies<br />
The process of consultation can be started by the General Manager and utilise various<br />
methods for obtaining community views. These can then be analysed by officers so that<br />
<strong>Council</strong> can resolve to endorse or amend the project brief.<br />
<strong>Mid</strong>-<strong>Western</strong> <strong>Regional</strong> <strong>Council</strong> Part B - Strategic Plan Page 53<br />
Strategic Business Plan for Sewerage
Objective 6: Community Involvement<br />
Seek community feedback with regard to service targets and prior to any major<br />
decisions regarding significant changes in service levels<br />
Performance Targets<br />
Consultation for water supply augmentation strategies<br />
Strategy<br />
Identify future projects/ major decisions requiring consultation<br />
Undertake consultation as required<br />
Objective 6: Actions Start End Responsible<br />
Strategy 1<br />
Cost $000<br />
Implement Ongoing<br />
Identify projects that require<br />
community consultation<br />
Annually<br />
(June)<br />
MWCW<br />
NAE<br />
Plan and prepare a program<br />
for future projects and<br />
communicate with<br />
stakeholders<br />
Annually<br />
(July)<br />
MWCW<br />
NAE<br />
Strategy 2<br />
Implement consultation<br />
program<br />
Report to <strong>Council</strong> for project<br />
approval<br />
Ongoing MWCW 2<br />
Ongoing GM / MWCW NAE<br />
Page 54 Part B - Strategic Plan <strong>Mid</strong>-<strong>Western</strong> <strong>Regional</strong> <strong>Council</strong><br />
Strategic Business Plan for Sewerage
Environment<br />
This section details <strong>Mid</strong>-<strong>Western</strong> <strong>Regional</strong> <strong>Council</strong>’s<br />
objective relating to environmental protection.<br />
The Environment objective addresses <strong>Council</strong>'s intentions in managing the sewerage<br />
schemes to minimise the impact on the environment, protect environmentally sensitive<br />
areas and promote ecological sustainability.<br />
It is recognised by <strong>Council</strong> that a responsible, region-wide approach to environmental<br />
protection and sustainable development is needed. <strong>Council</strong>’s programme will focus on<br />
identifying sensitive areas and undesirable outcomes. The driver is simply the need for<br />
the improvement of existing practices.<br />
<strong>Council</strong>’s vision is to conserve and enhance the natural environment through sustainable<br />
management practices. It also intends to develop, review or expand its environmental<br />
plan. As part of its development, the following will need to be considered:<br />
• People want effluent quality suitable for a diverse range of reuses;<br />
• Achieving environmental objectives should strengthen, not threaten the<br />
local economy; and<br />
• Local knowledge and enthusiasm for sustainability should be harnessed<br />
The current sewerage schemes have impacted the surrounding environment. <strong>Council</strong><br />
intends to keep the impact level at a minimum level by augmenting the STPs.<br />
Description<br />
Condition or<br />
“State” of the<br />
environment<br />
Pressures the human<br />
activities have on the<br />
environment<br />
Response of the<br />
<strong>Government</strong>,<br />
community etc<br />
Land<br />
Waste disposal<br />
sites<br />
Disposal of detritus,<br />
screenings from STP<br />
Disposal of sludge<br />
−<br />
−<br />
Land Burial<br />
Application on land<br />
Air<br />
Pump stations<br />
Sewage<br />
Treatment Plant<br />
Effluent reuse on land − Stringent<br />
environmental impact<br />
monitoring protocols<br />
Odour pollution − Ongoing maintenance<br />
of pumping stations<br />
−<br />
Monitoring and control<br />
of liquid trade waste<br />
contributors through<br />
trade waste policy<br />
Water Water quality Effluent disposal into<br />
waterbodies<br />
Downstream pollution<br />
−<br />
−<br />
Advanced wastewater<br />
treatment<br />
Stringent water quality<br />
monitoring protocols<br />
<strong>Mid</strong>-<strong>Western</strong> <strong>Regional</strong> <strong>Council</strong> Part B - Strategic Plan Page 55<br />
Strategic Business Plan for Sewerage
<strong>Council</strong> effectively addresses following main environment related issues of sewerage<br />
services in accordance with EPA/DEC and Health Department guidelines:<br />
• Handling and disposal of treated effluents and biosolids from STPs<br />
• Reuse of treated effluent for irrigation purposes<br />
• Ensuring sewerage services are included in the State of the Environment<br />
Report<br />
Integrated Water Cycle Management (IWCM)<br />
Integrated Water Cycle Management is a framework to help identify water management<br />
problems and to determine appropriate management responses so that social,<br />
environmental and economic objectives are met.<br />
IWCM involves the integration of the <strong>Council</strong>’s three main water services – water supply,<br />
sewerage and stormwater within a whole catchment strategic framework so that water<br />
is used optimally.<br />
It also involves the integration with other services for example roads and drainage, trade<br />
waste collection and with external requirements in particular the <strong>NSW</strong> Water Reforms.<br />
The first stage of development of IWCM is a concept study. This defines the catchment,<br />
water resource and urban water issues faced by <strong>Council</strong>. Once the issues are broadly<br />
defined, studies are undertaken to better define issues and look at ways of managing<br />
them.<br />
The second stage is to develop the strategy through undertaking detailed studies to better<br />
define the issues and look at cost-effective ways of managing them.<br />
<strong>Council</strong> plans to develop and adopt IWCM Strategies in accordance with the DEUS<br />
guideline document Integrated Water Cycle Management for <strong>NSW</strong> Water Utilities by<br />
December 2008.<br />
Page 56 Part B - Strategic Plan <strong>Mid</strong>-<strong>Western</strong> <strong>Regional</strong> <strong>Council</strong><br />
Strategic Business Plan for Sewerage
Objective 7: Environment<br />
An ecologically sustainable scheme whose environmental impacts, especially in sensitive<br />
areas, are acceptable to the community<br />
Performance Targets<br />
Prepare IWCM plan by December 2008<br />
Update annual State of the Environment (SOE) Report to highlight <strong>Council</strong>’s responsible<br />
management of the environment.<br />
Operate in accordance with Department of Environment and Conservation (DEC)<br />
licences<br />
Strategies<br />
Assess the environmental impacts of existing schemes and any new capital works where<br />
significant environmental impact is likely<br />
Objective 7: Actions Start End Responsible<br />
Strategy 1<br />
Cost $000<br />
Implement Ongoing<br />
Develop IWCM Plan<br />
March<br />
2008<br />
Dec<br />
2008<br />
MWCW 40<br />
Comply with EPA licence<br />
requirements<br />
Ongoing<br />
annually<br />
BMS<br />
NAE<br />
Review and update SOE<br />
report<br />
Nov<br />
Annually<br />
GMP<br />
NAE<br />
Reduction in EPA load fees<br />
after completion of capital<br />
works at Mudgee STP<br />
July<br />
2010<br />
Ongoing MWCW (80)<br />
Mitigate environmental<br />
impact of sewerage system<br />
overflows<br />
July<br />
2008<br />
June<br />
2011<br />
MWCW Refer to Objective 10:<br />
Capital Works<br />
Formalise Due Diligence Plan<br />
−<br />
Contingency Plan<br />
July<br />
2008<br />
Dec<br />
2008<br />
MWCW<br />
NAE<br />
−<br />
Environmental<br />
Management System<br />
−<br />
Maintenance Strategy<br />
<strong>Mid</strong>-<strong>Western</strong> <strong>Regional</strong> <strong>Council</strong> Part B - Strategic Plan Page 57<br />
Strategic Business Plan for Sewerage
Page 58 Part B - Strategic Plan <strong>Mid</strong>-<strong>Western</strong> <strong>Regional</strong> <strong>Council</strong><br />
Strategic Business Plan for Sewerage
Asset Management<br />
This section details <strong>Council</strong>’s objectives relating to<br />
the operation, maintenance and development of the<br />
physical assets that comprise the sewerage schemes<br />
The Asset Management Plan contains information that <strong>Council</strong> will use in managing its<br />
sewerage assets throughout their whole life cycle. This includes asset creation, operation,<br />
maintenance, replacement and disposal.<br />
Figure 7 - Best Practice Asset Management Approach<br />
Forward Planning<br />
Levels of Service<br />
Statutory and other<br />
Obligations<br />
Set Performance Requirements<br />
Regular review<br />
and update<br />
Identify System Elements/Facilities<br />
Assign & Monitor System<br />
Performance<br />
- delivery<br />
- condition<br />
- operation<br />
Unsatisfactory<br />
Analysis of Existing System<br />
Surplus Capacity<br />
Develop Solutions<br />
- Structural<br />
- Non Structural<br />
Satisfactory<br />
Develop Solutions<br />
- Improve utilisation<br />
- Disposal<br />
Capital Works Plan<br />
Refine Performance<br />
Requirements<br />
Disposal Plan<br />
Operations Plan<br />
Maintenance Plan<br />
Feedback<br />
Resource Management<br />
- Funding<br />
- Organisation / HR<br />
- Supplies<br />
<strong>Mid</strong>-<strong>Western</strong> <strong>Regional</strong> <strong>Council</strong> Part B - Strategic Plan Page 59<br />
Strategic Business Plan for Sewerage
The Plan should identify both current and projected capital works to satisfy future<br />
demands in terms of growth, improved Levels of Service and replacement of existing<br />
assets. Appropriate operation and maintenance activities should also be identified, to suit<br />
the desired level of service delivery. This should include documentation of the rules and<br />
procedures at system and facility level.<br />
The business plan develops objectives and strategies for the management of:<br />
• Operations;<br />
• Maintenance; and<br />
• Capital Works.<br />
Each of these components of the Plan deals with separate issues relating to the Scheme,<br />
but since they are interlinked several combinations of structured and non-structured<br />
solutions could result in providing the same level of service.<br />
Current <strong>Government</strong> policy is directed towards lifecycle asset management. Solutions in<br />
the past have often been capital intensive so there is potential generally to reduce capital<br />
works costs for councils over the long term. The ‘best practice’ flow chart describes a<br />
methodology for improving asset management planning. This model is not intended to<br />
reflect the structure of the Asset Management Plan but rather provides a guide for<br />
continuous improvement.<br />
Some of the benefits of implementing this type of model are:<br />
• Appropriate asset solutions;<br />
• Optimal balance of capital works and maintenance;<br />
• Maximisation of asset life and utility; and<br />
• Cost effective and sustainable asset management.<br />
This type of asset portfolio warrants significant investment of resources for its<br />
management. <strong>Council</strong> intends to adopt a total asset management approach for the<br />
scheme’s management to ensure that assets are managed as effectively as possible i.e.<br />
optimisation of the whole of the asset lifecycle rather than a focusing on asset creation<br />
alone.<br />
Anticipating the need for asset replacement is vital given the significant investment of<br />
resources involved and the need to ensure funds are available. Under the Total Asset<br />
Management approach a schedule of expected capital works is estimated into the future.<br />
This is used in the financial plan to ensure the required funds are available when needed.<br />
Page 60 Part B - Strategic Plan <strong>Mid</strong>-<strong>Western</strong> <strong>Regional</strong> <strong>Council</strong><br />
Strategic Business Plan for Sewerage
Asset Values<br />
The following Table shows a break-up of asset values of sewerage schemes of the <strong>Mid</strong>-<br />
<strong>Western</strong> <strong>Regional</strong> <strong>Council</strong>.<br />
Asset<br />
Pump Stations<br />
−<br />
−<br />
−<br />
−<br />
Mudgee<br />
Gulgong<br />
Rylstone<br />
Kandos<br />
Gravity and Rising<br />
Mains<br />
−<br />
−<br />
−<br />
−<br />
STPs<br />
−<br />
−<br />
−<br />
−<br />
Mudgee<br />
Gulgong<br />
Rylstone<br />
Kandos<br />
Mudgee<br />
Gulgong<br />
Rylstone<br />
Kandos<br />
No./ Capacity/<br />
Length<br />
5<br />
3<br />
2<br />
2<br />
123 Km<br />
31 Km<br />
11 Km<br />
28 Km<br />
8000 EP<br />
<strong>3000</strong> EP<br />
2000 EP<br />
2600 EP<br />
Year of<br />
Construction<br />
1971-2004<br />
1965-1969<br />
1971<br />
1972<br />
1930-2008<br />
1970-2008<br />
1971-2007<br />
1971-2005<br />
1930<br />
1997<br />
1971<br />
1972<br />
Current<br />
Written Down<br />
Value ($000)<br />
June 2006<br />
909<br />
369<br />
316<br />
23<br />
2,790<br />
1,584<br />
}2,374<br />
5,241<br />
3,609<br />
}809<br />
Current<br />
Replacement<br />
Cost ($000)<br />
June 2006<br />
1,215<br />
385<br />
260<br />
250<br />
16,925<br />
4,168<br />
1,402<br />
3,859<br />
10,000<br />
4,000<br />
3,000<br />
4,000<br />
Total - - 18,024 49,464<br />
<strong>Council</strong> has completed fair value assessment of assets in July 2007.<br />
<strong>Mid</strong>-<strong>Western</strong> <strong>Regional</strong> <strong>Council</strong> Part B - Strategic Plan Page 61<br />
Strategic Business Plan for Sewerage
Operations Plan<br />
Figure 8 - Operations Flowchart<br />
This section of the Plan outlines<br />
<strong>Council</strong>'s strategy for operation of<br />
the sewerage schemes in the<br />
future. The function of an<br />
operations plan is to ensure that<br />
the service objectives are achieved<br />
at the least cost, with minimal<br />
interruptions to services.<br />
LEVELS<br />
OF SERVICE<br />
& SERVICE<br />
DELIVERY<br />
Asset Condition Survey<br />
Asset<br />
Register<br />
Provision of the agreed Levels of<br />
Service to customers is dependent<br />
on the efficient and effective<br />
running of sewerage operations.<br />
An operations analysis will<br />
interface the operations and capital<br />
works plans by identifying what<br />
level of service the existing assets<br />
can provide and what additional<br />
works are needed to bridge any<br />
gap between existing and desired<br />
services.<br />
Performance<br />
Requirements &<br />
constraints for<br />
Sub-Systems & Facilities<br />
Operations Analysis<br />
Facility Operating<br />
Procedures<br />
System Operating Rules<br />
The operations plan is based on<br />
knowledge of the system assets<br />
and as such there are ongoing<br />
requirements for maintaining an<br />
appropriate asset register and for<br />
investigating the condition of key<br />
elements of the systems that affect<br />
the ability to deliver the desired<br />
MAINTENANCE<br />
PLAN<br />
CAPITAL WORKS<br />
PLAN<br />
Levels of Service. Contingency plans (emergency response plans) should be developed<br />
where the impact of failure is significant. The existing inspection and maintenance<br />
procedures are appropriate, however the utilisation of improved technology need to be<br />
investigated.<br />
Asset condition surveys required include CCTV and spot check inspections of sewer lines<br />
in the reticulation system. The Asset Register should be updated as an integral part of this<br />
recording process.<br />
There are various documentation requirements for sewerage operations. Operating rules<br />
and procedures for both normal condition and breakdown contingencies need to be<br />
established. These should include system performance requirements and constraints,<br />
and cross reference to specific plant operations manuals.<br />
Page 62 Part B - Strategic Plan <strong>Mid</strong>-<strong>Western</strong> <strong>Regional</strong> <strong>Council</strong><br />
Strategic Business Plan for Sewerage
<strong>Council</strong> recognises that a monitoring telemetry system leads to best operating efficiency<br />
and improves resource utilisation. Further operations planning requirements for the<br />
<strong>Council</strong> are:<br />
• Updating system operating rules and performance requirements for all<br />
subsystems and facilities;<br />
• Implementing an effective Assets Management System that will enable<br />
identification of conditions of assets from assets register and maintenance<br />
reports; and<br />
• Compliance with OHS requirements<br />
Main operational issues include the following:<br />
• Optimising operations to reduce costs<br />
• Monitoring of operational performance<br />
• Review and document operating procedures<br />
Occupational health and safety hazards in the <strong>Council</strong>’s sewerage operations include:<br />
• Bacterial contamination<br />
• Falling into storages/ lagoons<br />
• Falling off structures<br />
• Moving heavy mechanical parts<br />
• Chemical exposures and handling<br />
• Injuries due to sharps<br />
• Electrical injuries<br />
• Confined spaces<br />
<strong>Council</strong> has developed an OH&S Policy outlining the roles and responsibilities of all<br />
employees within the <strong>Council</strong>. As part of <strong>Council</strong>’s ongoing commitment to Occupational<br />
Health and Safety requirements, all staff are familiar with the amendments to the OH&S<br />
Act, Local <strong>Government</strong> Act 1993 and the Protection of the Environment (Operations) Act<br />
1997.<br />
On an annual basis the sewerage schemes including the treatment plant, pumps,<br />
reticulation lines and other associated areas are reviewed to ensure all risks are assessed<br />
and minimised. For more information refer to the <strong>Council</strong>’s Occupational Health & Safety<br />
Policy.<br />
<strong>Mid</strong>-<strong>Western</strong> <strong>Regional</strong> <strong>Council</strong> Part B - Strategic Plan Page 63<br />
Strategic Business Plan for Sewerage
Objective 8: Operations<br />
Develop operations plan and procedures to achieve levels of service with due diligence<br />
and effective use of technology so as to ensure a reliable and safe service at minimum<br />
operating costs<br />
Performance Targets<br />
Undertake operations analysis by December 2008<br />
No failures to deliver agreed Levels of Service due to operations related problems<br />
Strategies<br />
Develop an Operations Plan<br />
Operate the scheme in accordance with documented operating procedures<br />
Objective 8: Actions Start End Responsible<br />
Strategy 1<br />
Cost $000<br />
Implement Ongoing<br />
Develop electronic asset<br />
management system<br />
Started<br />
Sep<br />
2008<br />
MTS 50 5<br />
Asset data transfer to<br />
electronic asset register<br />
Ongoing MTS NAE<br />
Update asset valuation<br />
June<br />
2007<br />
Every 5<br />
Years<br />
MTS/MF<br />
NAE<br />
Identify and assess condition<br />
of assets<br />
−<br />
−<br />
Civil<br />
Mech.& Elec.<br />
Strategy 2<br />
Update Operations Plan<br />
−<br />
−<br />
Operations analysis<br />
Completion of<br />
documentation of<br />
procedures and practices<br />
Annual review and<br />
implementation of<br />
recommended operational<br />
changes<br />
July<br />
2007<br />
July<br />
2008<br />
July<br />
2008<br />
Ongoing MWCW 50<br />
Dec<br />
2008<br />
Jun<br />
2009<br />
BMS/ MWCW<br />
NAE<br />
Annually BMS/ MWCW NAE<br />
Page 64 Part B - Strategic Plan <strong>Mid</strong>-<strong>Western</strong> <strong>Regional</strong> <strong>Council</strong><br />
Strategic Business Plan for Sewerage
Maintenance Plan<br />
Figure 9 - Maintenance Flowchart<br />
The Maintenance Plan is to ensure<br />
that the Operations Plan’s outputs,<br />
reliability and availability of the<br />
sub-systems, facilities and<br />
components are achieved in the<br />
most cost effective manner. The<br />
most important factor is<br />
identification of the risk to system<br />
performance from failure of each<br />
asset. This leads to a minimum<br />
performance standard for each<br />
asset.<br />
Records should be kept of<br />
maintenance and operations<br />
requirements. The aim is to<br />
reduce delays or periods of<br />
reduced service. Determine the<br />
limit of acceptable substandard<br />
operation and determine the cost<br />
effective breakeven point.<br />
Fixed Time<br />
Maintenance<br />
(Identify: maintenance<br />
tasks and frequency)<br />
Fixed Time<br />
Maintenance<br />
Program/Schedule<br />
Scheduled<br />
Maintenance<br />
Determine<br />
Maintenance Strategy<br />
for Each Component<br />
Condition Based<br />
Maintenance<br />
(Identify: what, how<br />
and when to inspect<br />
criteria and/ or<br />
rehabilitation)<br />
Develop Condition<br />
Monitoring<br />
Program/Schedule<br />
Criticality of<br />
Assets<br />
Breakdown<br />
Maintenance<br />
Develop Breakdown<br />
Response Plan<br />
The most cost effective strategy<br />
should be identified as either:<br />
Develop Resources &<br />
Costs to Implement<br />
Determine Resources<br />
& Costs to Implement<br />
Determine Resources<br />
& Costs to Implement<br />
Scheduled maintenance - fixed<br />
time or condition based;<br />
Reactive maintenance - failure<br />
basis.<br />
Prioritise<br />
Review<br />
The thrust of the <strong>Government</strong>’s<br />
total asset management guidelines<br />
is to make the best use of existing<br />
Implement<br />
assets by implementing systematic<br />
maintenance and rehabilitation<br />
plans. It could therefore be that increased maintenance costs will result from a critical<br />
review of the maintenance area. This in turn would be expected to be more than<br />
compensated for by a reduction in the need for capital works.<br />
A complete assessment of the system is needed for the development of sound strategies<br />
to ensure the Levels of Service are not jeopardised by failure to address maintenance<br />
problems. A maintenance plan is needed to incorporate appropriate maintenance<br />
schedules and procedures. This should include references to specific plant maintenance<br />
manuals.<br />
<strong>Mid</strong>-<strong>Western</strong> <strong>Regional</strong> <strong>Council</strong> Part B - Strategic Plan Page 65<br />
Strategic Business Plan for Sewerage
Maintenance Plan needs to consider the following information and issues regarding the<br />
existing system:<br />
• Need to update Operation and Maintenance (O&M) manuals and an O&M<br />
plan;<br />
• Criticality analysis of systems to identify components of high risk<br />
• Need for spare parts inventory<br />
• Need for refresher training of key staff dealing with customers and mission<br />
critical functions.<br />
Page 66 Part B - Strategic Plan <strong>Mid</strong>-<strong>Western</strong> <strong>Regional</strong> <strong>Council</strong><br />
Strategic Business Plan for Sewerage
Objective 9: Maintenance<br />
Increase the reliability of systems, reduce life cycle and ongoing costs, allow for<br />
appropriate financial planning and ensure levels of service are maintained<br />
Performance Targets<br />
Review maintenance strategy by December 2009<br />
Strategies<br />
Implement and review appropriate maintenance strategy to meet levels of service<br />
requirements<br />
Objective 9: Actions Start End Responsible<br />
Strategy 1<br />
Cost $000<br />
Implement Ongoing<br />
Develop detailed<br />
Maintenance Plan<br />
−<br />
−<br />
−<br />
−<br />
Asset criticality<br />
assessment<br />
Predictive maintenance for<br />
critical assets<br />
Scheduled maintenance<br />
for less critical assets<br />
Breakdown maintenance<br />
strategy<br />
Implement work order<br />
management system<br />
January<br />
2009<br />
Sept<br />
2008<br />
Jun<br />
2009<br />
MWCW 15<br />
Ongoing MTS NAE<br />
Undertake maintenance cost<br />
analysis for renewals<br />
July<br />
2009<br />
Dec<br />
2009<br />
MWCW<br />
NAE<br />
Review and document<br />
Contingency Plans<br />
July<br />
2009<br />
Dec<br />
2009<br />
MWCW<br />
NAE<br />
−<br />
Sewage treatment plants<br />
and Pump stations<br />
<strong>Mid</strong>-<strong>Western</strong> <strong>Regional</strong> <strong>Council</strong> Part B - Strategic Plan Page 67<br />
Strategic Business Plan for Sewerage
Capital Works<br />
Figure 10 - Capital Works Flowchart<br />
The capital works plan should make an<br />
assessment of scheduled work for<br />
growth, non-growth, and rehabilitation<br />
works over a 30-year period.<br />
OPERATIONS<br />
PLAN<br />
MAINTENANCE<br />
PLAN<br />
The Capital Works Plan is of crucial<br />
importance because sewerage<br />
infrastructure is capital intensive and the<br />
construction and renewal of facilities can<br />
have a significant impact on <strong>Council</strong>’s<br />
overall finances.<br />
Demand<br />
Forecasts<br />
Formulate<br />
Options<br />
CUSTOMER<br />
SERVICE<br />
PLAN<br />
In the process of preparing the Capital<br />
Works Plan, the following points have<br />
been considered:<br />
Social &<br />
Environmental<br />
Analysis<br />
Economic<br />
Analysis<br />
Technical<br />
Analysis<br />
• The development of sewerage<br />
schemes is a long-term<br />
investment, and must be<br />
integrated with <strong>Council</strong> planning<br />
policies.<br />
Comparative<br />
Analysis<br />
Select Preferred<br />
Option<br />
• The capital works strategy needs<br />
to be regularly updated to take<br />
account of changing conditions.<br />
Draft Capital<br />
Works Plan<br />
• Consideration of the costs and<br />
benefits of alternative options.<br />
• Acceptance by the community of<br />
the development proposals and<br />
costs.<br />
FINANCIAL PLAN<br />
A summary of the 30-year capital<br />
expenditure program is shown in Part C of this Plan.<br />
On the forward budget for the sewerage scheme the following capital works have been<br />
included:<br />
• Mudgee STP augmentation<br />
• Rylstone/Kandos STP<br />
• Charbon/Clandulla sewerage scheme<br />
• Gulgong STP augmentation<br />
• Reticulation main replacement<br />
• Telemetry upgrade<br />
Page 68 Part B - Strategic Plan <strong>Mid</strong>-<strong>Western</strong> <strong>Regional</strong> <strong>Council</strong><br />
Strategic Business Plan for Sewerage
Objective 10: Capital Works<br />
Capital works program provides agreed levels of service at optimal life-cycle costs to<br />
meet social, economic and environmental considerations<br />
Performance Targets<br />
No failures to deliver agreed Levels of Service due to lack of infrastructure and<br />
sufficient infrastructure is in place to cater for the projected developments<br />
Strategy<br />
Plan and construct capital works within financial constraints<br />
Objective 10: Actions Start End Responsible<br />
Strategy 1<br />
Cost $000<br />
Implement Ongoing<br />
Prepare a long-term (30-<br />
years) capital works plan<br />
−<br />
−<br />
For backlog areas<br />
For growth<br />
Feb 2009<br />
(biennially)<br />
June<br />
2009<br />
GMA<br />
Refer to Capital<br />
Works Plan in Part C<br />
– Detailed Information<br />
−<br />
For renewal/ replacement<br />
Review capital works plan as<br />
part of Management Plan<br />
Annually<br />
(Nov)<br />
Annually<br />
(Feb)<br />
MWCW<br />
NAE<br />
Review economic analysis to<br />
determine preferred capital<br />
work options<br />
As<br />
required<br />
MF/MWCW<br />
Included in project<br />
costs<br />
Engage consultants for<br />
design and preparation of<br />
tender documents<br />
As<br />
required<br />
MWCW<br />
As per Capital Works<br />
Plan<br />
<strong>Mid</strong>-<strong>Western</strong> <strong>Regional</strong> <strong>Council</strong> Part B - Strategic Plan Page 69<br />
Strategic Business Plan for Sewerage
Page 70 Part B - Strategic Plan <strong>Mid</strong>-<strong>Western</strong> <strong>Regional</strong> <strong>Council</strong><br />
Strategic Business Plan for Sewerage
Human Resources<br />
This section details <strong>Council</strong>’s objectives relating to<br />
the development of human resources required for<br />
operating the sewerage service<br />
The Human Resources Plan is to ensure that <strong>Council</strong> has the appropriate staff numbers<br />
with the necessary skills to meet current and future requirements. If these are in order,<br />
<strong>Council</strong>’s Levels of Service can be met.<br />
The General Manager delegates authority to the Group Manager – Assets who in turn<br />
delegates responsibility to the Manager Water Cycle and Waste to manage all the water<br />
supply assets.<br />
The operation, maintenance and construction of assets are contracted to <strong>Mid</strong>-<strong>Western</strong><br />
Operations, an internal service provider. <strong>Mid</strong>-<strong>Western</strong> Operations has 23 staff, who<br />
operate and maintain the water supply and sewerage schemes. The organisational<br />
structure is shown next page.<br />
Important human resources issues being considered by the <strong>Council</strong> are as follows:<br />
• There is the need to ensure operators are familiar with all current practices<br />
including OH&S requirements; and<br />
• Need to ensure an up to date training program is in place for all staff (in<br />
particular training the treatment plant operators and tertiary training for<br />
engineering staff).<br />
• Succession planning for senior technical staff<br />
<strong>Mid</strong>-<strong>Western</strong> <strong>Regional</strong> <strong>Council</strong> Part B - Strategic Plan Page 71<br />
Strategic Business Plan for Sewerage
Figure 11 – <strong>Mid</strong>-<strong>Western</strong> <strong>Council</strong> Organisation Structure<br />
Executive<br />
Secretaries<br />
GENERAL<br />
MANAGER<br />
GENERAL MANAGER’S<br />
DEPARTMENT<br />
Human Resources<br />
Media and Promotions<br />
GROUP MANAGER<br />
GROUP MANAGER<br />
GROUP MANAGER<br />
GROUP MANAGER<br />
ASSET MANAGEMENT<br />
MID-WESTERN<br />
OPERATIONS<br />
PLANNING AND<br />
DEVELOPMENT<br />
COMMUNITY AND<br />
CORPORATE SERVICES<br />
Roads and Bridges<br />
Water and Sewerage<br />
Stormwater and Drainage<br />
Airports<br />
Saleyards<br />
Caravan Parks<br />
Quarry<br />
Depot<br />
Plant and Equipment<br />
Design<br />
Recreational facilities<br />
Information Technology<br />
Tips and waste transfer stations<br />
Quality Assurance<br />
Fire Control<br />
Emergency Management<br />
Reserves Management<br />
GIS<br />
<strong>Council</strong> and Community Buildings and<br />
Facilities<br />
Operation, construction and<br />
maintenance of <strong>Council</strong> Assets<br />
Pool Operations<br />
Noxious Weeds – Roadside<br />
spraying<br />
Strategic Planning<br />
Town Planning<br />
Development Applications<br />
Building Control<br />
Health Control<br />
Heritage<br />
Environmental Awareness<br />
Finance and Treasury<br />
Auditing<br />
Insurance<br />
Customer Service<br />
Governance<br />
Governance Policy<br />
Economic Development<br />
Legal<br />
Records<br />
Financial Assistance Program<br />
Tourism<br />
Libraries<br />
Meals on Wheels<br />
Home modifications<br />
Community Transport<br />
Youth Services<br />
Cultural Services<br />
Family Day Care and Child Care<br />
355 Committees<br />
Noxious weeds – Property inspection<br />
and compliance<br />
Animal Control<br />
Implementation of Social Plan<br />
Page 72 Part B - Strategic Plan <strong>Mid</strong>-<strong>Western</strong> <strong>Regional</strong> <strong>Council</strong><br />
Strategic Business Plan for Sewerage
Objective 11: Human Resources<br />
Maintain an appropriate staff structure and staff numbers with the necessary training<br />
and skills to effectively manage the sewerage schemes and provide agreed and<br />
required Levels of Service<br />
Performance Targets<br />
Review and update HR Plan by June 2008<br />
Strategy<br />
Employ/ replace staff to meet needs and establish an ongoing staff training program<br />
Objective 11: Actions Start End Responsible<br />
Strategy 1<br />
Cost $000<br />
Implement Ongoing<br />
Document HR Plan<br />
−<br />
−<br />
Position analysis<br />
Needs (resources/skills)<br />
analysis<br />
Document and implement<br />
training and retraining plans<br />
Annual performance review<br />
March<br />
2007<br />
Annually<br />
(Oct)<br />
Annually<br />
(Oct)<br />
June<br />
2008<br />
BMS<br />
BMS<br />
NAE<br />
NAE<br />
Ongoing BMS NAE<br />
<strong>Mid</strong>-<strong>Western</strong> <strong>Regional</strong> <strong>Council</strong> Part B - Strategic Plan Page 73<br />
Strategic Business Plan for Sewerage
Page 74 Part B - Strategic Plan <strong>Mid</strong>-<strong>Western</strong> <strong>Regional</strong> <strong>Council</strong><br />
Strategic Business Plan for Sewerage
Finance<br />
This section details <strong>Mid</strong>-<strong>Western</strong> <strong>Regional</strong> <strong>Council</strong>’s<br />
objectives relating to the business operation and<br />
financial management of the sewerage funds<br />
The purpose of the Financial Plan is to enable <strong>Council</strong> to determine the revenues needed<br />
to meet the Levels of Service over the long term and effectively manage the cash flow.<br />
Legislation requires separate accounting for sewerage services and elimination of cross<br />
subsidisation with other of <strong>Council</strong>’s activities where possible. Any cross subsidy deemed<br />
necessary by <strong>Council</strong> should be explicitly noted.<br />
Commitment by <strong>Council</strong> to provide the Levels of Service described in this document<br />
requires collection of revenues of the order shown in the detailed tables and graphs in<br />
Part C. Estimates of the cost of activities in the action plan have been modelled using the<br />
<strong>NSW</strong> Financial Model issued by the Department of Energy, Utilities and Sustainability and<br />
represent the best projection of future costs possible at this time. Actual billings will<br />
depend on the levels of developer charges and pricing structure adopted.<br />
Generally, recurrent operating costs should be covered by the annual sewerage charges.<br />
Capital funds are drawn from the following four sources:<br />
• Developer charges;<br />
• <strong>Government</strong> grants; and<br />
• Cash and borrowings.<br />
There is pressure to provide a suitable financial plan because DEUS requires that the<br />
existing financial plans be updated to evaluate the impacts of the proposed capital works<br />
on the sewerage charges.<br />
In accordance with the DEUS Financial Planning Guidelines, <strong>Council</strong> will develop its longterm<br />
financial models and establish a steady price path. This will be used to set the<br />
pricing structure in accordance with the Best Practice Management Guidelines.<br />
<strong>Council</strong> will update its financial models annually as part of its ongoing planning review<br />
process.<br />
<strong>Mid</strong>-<strong>Western</strong> <strong>Regional</strong> <strong>Council</strong> Part B - Strategic Plan Page 75<br />
Strategic Business Plan for Sewerage
Objective 12: Finance<br />
Maintain sound financial management of the organisation by optimising long term (30-<br />
years) financial plans to provide required services at an affordable level and ensure full<br />
cost recovery<br />
Performance Targets<br />
Quarterly review and annual updating of financial plan<br />
Strategies<br />
Maintain current Financial Plan<br />
Objective 12: Actions Start End Responsible<br />
Strategy 1<br />
Cost $000<br />
Implement Ongoing<br />
Review cost projections for<br />
long term Financial Plan, with<br />
the aim of reduction in the<br />
costs of operations and<br />
maintenance<br />
Annually MF/MWCW NAE<br />
Update Financial Plan Annually MF/ MWCW NAE<br />
Agree on price path for setting<br />
the tariff in accordance with the<br />
DEUS guidelines<br />
Annually MF/MWCW Refer to objective 5:<br />
Service Pricing<br />
Page 76 Part B - Strategic Plan <strong>Mid</strong>-<strong>Western</strong> <strong>Regional</strong> <strong>Council</strong><br />
Strategic Business Plan for Sewerage
PART C:<br />
DETAILED INFORMATION<br />
Part C of the plan provides more detailed<br />
information about select elements of the<br />
plan. Included in this section is information<br />
on:<br />
<br />
<br />
<br />
<br />
Financial Management<br />
Projected Cost Schedules<br />
Financial Model Outcomes<br />
Operating Environment Review<br />
<strong>Mid</strong>-<strong>Western</strong> <strong>Regional</strong> <strong>Council</strong> Part C - Detailed Information Page 77<br />
Strategic Business Plan for Sewerage
Page 78 Part C - Detailed Information <strong>Mid</strong>-<strong>Western</strong> <strong>Regional</strong> <strong>Council</strong><br />
Strategic Business Plan for Sewerage
Financial Management<br />
Contains a summary of the financial modelling process and the input data used.<br />
Overview of Financial Planning<br />
The objective of financial planning is to model the full life cycle costs for the preferred<br />
service planning option and to determine appropriate funding strategies and to ensure that<br />
the services remain affordable in the long term.<br />
By taking a long-term view, financial peaks and troughs can be smoothed to provide the<br />
basis for a consistent charging policy and to highlight any current impact of future actions.<br />
The new <strong>NSW</strong> Financial Planning Model (FINMOD Version 4.0), issued by the<br />
Department of Water and Energy (previously DEUS) in November 2003, has been used<br />
for this modelling. A 30-year planning horizon has been adopted as recommended in the<br />
Department of Energy, Utilities and Sustainability Guidelines.<br />
To establish a financial plan various scenarios are explored in order to determine the best<br />
funding strategy.<br />
It is important to identify a logical progression of asset creation, rehabilitation, and<br />
replacement over at least 20 years in order to develop a working perspective for the<br />
management of these infrastructure assets which have expected lives of up to one<br />
hundred years.<br />
The preferred model presented here assumes that government grants are available to<br />
<strong>Council</strong> for the Mudgee STP augmentation work. Where funding from revenue would<br />
require an unrealistic level of charging in the short term then borrowing will be undertaken.<br />
The overall goals of financial modelling are to optimise a long term funding strategy to<br />
meet the demands of the capital works programme and day to day operations, while<br />
ensuring a minimum level of cash liquidity and a stable level of average residential<br />
charges.<br />
AAS27 reporting for the financial statements requires that all funds be declared as assets<br />
under cash and investments in the statement of financial position. Also that assets are<br />
valued on a fair value basis which is depreciated current replacement cost or market value<br />
depending on the type of asset.<br />
All capital works estimates in the text are quoted in real (2006) dollars unless specified<br />
otherwise. The output data is quoted in real and inflated dollars.<br />
When assessing affordability, note that a $1 charge now will be equivalent to $1.80 in 20<br />
years time, assuming a 3% annual inflation rate.<br />
A summary of the financial modelling results is included on the following pages and<br />
detailed input and output data are available in the Appendices.<br />
<strong>Mid</strong>-<strong>Western</strong> <strong>Regional</strong> <strong>Council</strong> Part C - Detailed Information Page 79<br />
Strategic Business Plan for Sewerage
Model Description<br />
The financial model forecasts income<br />
streams to match projected expenditure. The<br />
diagram on the right illustrates the main<br />
elements, which affect the financial plan.<br />
Income<br />
Annual<br />
Charges<br />
Elements of Financial Modelling<br />
Expenditure<br />
O&M<br />
The financial modelling undertaken in this<br />
plan aims to:<br />
• optimise the long term funding<br />
strategy,<br />
Developer<br />
Charges<br />
New Assets<br />
• meet the demands of the capital<br />
works program and other life cycle<br />
costs of the system assets,<br />
• ensure a minimum level of cash<br />
liquidity, and<br />
Trade W aste<br />
Subsidy<br />
Sewer<br />
Fund<br />
Asset<br />
Renewal<br />
Interest<br />
• provide a forecast of the typical<br />
residential annual charges over the<br />
long term.<br />
Interest<br />
Depreciation<br />
(non cash)<br />
Modelling Methodology<br />
Input data for the model is sourced from three main areas:<br />
• AAS27 special schedules for past financial performance of the water and<br />
sewerage funds<br />
• Estimates for uncontrollable variables eg interest rates, growth, inflation<br />
• Projected capital works, and operations and management expenses<br />
All other criteria being met, the financial plan seeks, after an initial adjustment, to model,<br />
in real dollars, the lowest steady level of charging possible. Actual bills will depend on<br />
<strong>Council</strong>’s pricing structure but this is indicative of the affordability of the services and<br />
shows the performance requirements for long-term stability.<br />
A number of variables and assumptions have to be entered into the model and these are<br />
first agreed to by <strong>Council</strong>. They include:<br />
Opening balances<br />
<strong>Council</strong>’s special accounting schedules are used to establish opening balances and<br />
baseline costs for the model. Financial statements for the last two years are compared to<br />
try to eliminate ‘one off’ occurrences from being incorporated as part of a normal trend.<br />
Developer Charges<br />
New assessments have to pay a developer charge for the benefits being received by<br />
connecting to the system. Currently <strong>Council</strong> is reviewing the developer charges<br />
calculation to introduce developer charges in accordance with DWE best practice<br />
management guidelines and has adopted $3,198/ET as developer charges for<br />
implementation from year 2008/09 onwards.<br />
Page 80 Part C - Detailed Information <strong>Mid</strong>-<strong>Western</strong> <strong>Regional</strong> <strong>Council</strong><br />
Strategic Business Plan for Sewerage
Growth Projections<br />
A long-term average residential connection growth rate of 1.7% p.a. has been used for<br />
sewerage services. This rate of growth is based on <strong>Council</strong>’s report on recent review of<br />
25-year population growth projections for the Region.<br />
Inflation<br />
Average long-term inflation has been assumed as 3.0% per annum.<br />
Interest Rates<br />
A borrowing rate of 6.5% and investment rate of 5.5% have been used in this analysis<br />
Revenue from non-residential customers<br />
The revenue split is the ratio of residential to non-residential revenues. This is determined<br />
from the special schedules. If a significant change is envisaged (eg increased income<br />
from trade waste charges) then the split can be adjusted to match. Residential charges<br />
currently account for 88% of sewerage revenues. Current revenue split is expected to<br />
continue also with the adoption of DWE best practice tariff structure from year 2008/09<br />
onwards.<br />
Performance Measures<br />
<strong>Council</strong>’s minimum service criteria will have an impact on the level of charges required,<br />
eg. minimum cash levels, which is generally assumed to be 10 - 20% of annual revenues<br />
(excluding restricted revenues). For the financial model, $ 1000 K (2006$) has been<br />
considered as minimum cash level.<br />
Expected lives of assets<br />
The default average life of system assets is based on the weighted average of long-lived<br />
structures and shorter-lived mechanical plant. The average life of water and sewerage<br />
assets is currently estimated to be approximately 70 years. The life of assets controls the<br />
depreciation, which is a non-cash expense. It directly affects the need for future asset<br />
renewal works planned, which is part of the capital works program.<br />
Grants and Subsidy for Capital Works<br />
The State <strong>Government</strong> provides financial assistance to local government water supply<br />
and sewerage schemes through the Country Towns Water, Sewerage and Drainage<br />
Program. <strong>Council</strong>s can apply for funding of up to 50% of Improved Level of Service (ILOS)<br />
capital works if their average residential charge is more than $350 per annum. The<br />
financial model in this case has considered that 25% of the total estimated cost of Mudgee<br />
STP augmentation work will be available as government subsidy.<br />
Ongoing recurrent costs: Management, Operations and Maintenance<br />
By default, the model increases historical operation and maintenance expenses on a pro<br />
rata basis with respect to growth. This has been overridden where <strong>Council</strong> provided<br />
revised estimates i.e. where the action plan requires new initiatives or where new works<br />
require additional operating resources.<br />
The capital works plan and projected operations and management expenses also form a<br />
significant component of the inputs. These are shown in the section ‘Projected Cost<br />
Schedules’.<br />
<strong>Mid</strong>-<strong>Western</strong> <strong>Regional</strong> <strong>Council</strong> Part C - Detailed Information Page 81<br />
Strategic Business Plan for Sewerage
Assumptions and Limitations<br />
The projections of the financial plans are based on past financial performance. Allowance<br />
is made for new initiatives, future rate forecasts, and maintenance of sustainable levels of<br />
service as identified in the strategic planning process.<br />
The depreciation is shown in the operating statement but this is not a cash item. The<br />
financial planning model manages the cash flow but keeps a running tally of cumulative<br />
depreciation so that <strong>Council</strong> can appreciate the potential future liability for maintaining the<br />
value in the system and levels of service. By planning ahead and making optimum use of<br />
existing assets, a more cost-effective and efficient service should result.<br />
Average annual residential charge is used as the performance measure representing<br />
overall revenue requirements from residential customers. This should not be confused<br />
with pricing. Pricing, i.e. distribution of the charges according to consumption or special<br />
customer groups, is the subject of a separate revenue planning exercise.<br />
The financial model is not a substitute for normal budgeting (that is, short-term financial<br />
planning). The model assumes that all expenses and income occur at the beginning of the<br />
year and is therefore not appropriate to track cash flow throughout the year. It is<br />
important, however, that the budgeting process is carried out within the framework of the<br />
long-term financial plan.<br />
The Capital Works Plan provides a guide for estimation of long-term operation and<br />
maintenance costs. It is accepted that the level of confidence in these projections reduces<br />
with time but it is important to identify as many future commitments and liabilities as<br />
possible.<br />
The Modelling Process<br />
Phase 1 – Initial runs<br />
The objective of Phase 1 development is<br />
to present a first cut model of options for<br />
future service provision. Comparison of<br />
outcomes enables <strong>Council</strong> to make<br />
decisions as to the preferred model and<br />
the most beneficial and practical funding<br />
solution for the proposed asset<br />
management programs.<br />
Funding<br />
In considering funding for future options<br />
there are three basic options:<br />
• Fund all capital works from<br />
revenues.<br />
• Borrow to fund all capital<br />
works.<br />
• Fund capital works from a<br />
mix of borrowing and<br />
revenue<br />
Most councils would prefer to avoid<br />
borrowing to fund their capital works<br />
programs if possible. This strategy<br />
obviously avoids incurring interest<br />
Base Case<br />
Scenario<br />
Assumptions<br />
Strategy<br />
Affordability<br />
Phase2 BRIEF<br />
Phase1 REVIEW<br />
Review base data:<br />
Interest Rates<br />
Developer Charges<br />
etc<br />
Funding options<br />
Debt ratio<br />
Cash liquidity<br />
etc.<br />
Delay capital works<br />
Delete projects<br />
Use structured<br />
loans<br />
Page 82 Part C - Detailed Information <strong>Mid</strong>-<strong>Western</strong> <strong>Regional</strong> <strong>Council</strong><br />
Strategic Business Plan for Sewerage
charges. Where capital works costs are low and cash levels are high this may be possible<br />
but it may also suggest that current levels of charging are too high.<br />
On the other hand deferring expenditure is consistent with the goal of inter-generational<br />
equity when considering long-term asset management. Longer period loans spread the<br />
cost of works over a longer period, eliminating early peaks in annual charges. Often<br />
councils will have no choice except to borrow for major projects because collecting<br />
sufficient cash in advance is impracticable and would require an unacceptably high level<br />
of charges.<br />
In general most councils use a mix of revenue and borrowings to meet <strong>Council</strong>’s financial<br />
performance policy criteria. Given that this is achieved, the latest DEUS Guidelines<br />
recommend adoption of the lowest possible steady rate of long-term charges in real terms<br />
that is achievable. In the Phase 1 runs of the model the default loan period used was<br />
twenty years.<br />
Phase 2 – Preferred model and sensitivity<br />
After consideration of Phase1 issues a preferred option will be finally reviewed and<br />
updated to suit any last minute planning refinements and detailed cost estimating carried<br />
out.<br />
While the preferred model reflects the expected performance of the systems, it does not<br />
give any indication of the sensitivity of the proposed solution should the basic<br />
assumptions used prove significantly different in practice.<br />
It is recommended that a sensitivity analysis be carried out if it is perceived that a variable<br />
may change significantly in the future. The value of a sensitivity analysis is that it shows:<br />
• the sensitivity of the results to assumptions (uncontrollable variables)<br />
• the impact of changing controllable variables.<br />
The guidelines suggest that a number of sensitivities be carried out to test the robustness<br />
of the plan. In regard to controllable variables such as type of loan structure, level of<br />
developer charges etc., the model enables <strong>Council</strong> to make decisions to establish the<br />
right management policies.<br />
It is important to demonstrate the impact of the ‘no subsidy’ scenario, which shows the<br />
potential benefits of government assistance. <strong>Council</strong>’s expectations for receiving subsidy<br />
are included in the final preferred model as being the most realistic future scenario.<br />
With uncontrollable variables, <strong>Council</strong> is at the mercy of change. The downside risk of an<br />
increase in interest rates, or low growth rates, or rise in energy costs, may be<br />
considerable. Increasingly the impact of water demand management may be felt in the<br />
future and expected water savings although resulting in loss of revenues, should be more<br />
than compensated for by deferment of capital works and lower operational costs.<br />
On-going Review<br />
Over time, changes in model variables can have a significant impact on the model’s<br />
accuracy and this has implications for <strong>Council</strong>’s forward planning. It is recommended that<br />
the models be revisited regularly to ensure that they retain their currency. Where <strong>Council</strong><br />
has an active capital works program requiring subsidy then annual updates are<br />
recommended.<br />
<strong>Mid</strong>-<strong>Western</strong> <strong>Regional</strong> <strong>Council</strong> Part C - Detailed Information Page 83<br />
Strategic Business Plan for Sewerage
Page 84 Part C - Detailed Information <strong>Mid</strong>-<strong>Western</strong> <strong>Regional</strong> <strong>Council</strong><br />
Strategic Business Plan for Sewerage
Projected Cost Schedules<br />
This section looks at the projected capital works and recurrent expenditure for the next 20 years.<br />
CAPITAL WORKS<br />
Growth works - Work required to increase the capacity of<br />
facilities, to service new subdivision.<br />
Improved level of service works<br />
(backlog works)<br />
- Works to provide better public health and<br />
environmental standards, better service, higher<br />
reliability, or an extension of services to<br />
unserviced existing development.<br />
Works in this category may be eligible for<br />
<strong>Government</strong> grants.<br />
Asset renewal works - Renewal/replacement of existing assets, which<br />
have aged and reached the end of their useful<br />
life.<br />
RECURRENT COSTS<br />
Management - Reflects true overheads associated with<br />
providing this service. Any cross subsidies with<br />
General Fund should be eliminated or explicitly<br />
disclosed in the Annual Accounts.<br />
Operations and Maintenance - It is assumed that the current level of costs<br />
shown in the Financial Statements reflects a<br />
realistic level of expenditure for the current<br />
schemes. The projections assume costs<br />
increased in proportion to the growth.<br />
Model cost overrides - Additional costs are included where specific<br />
activities have been identified in future years.<br />
This includes new initiatives plus additional<br />
costs associated with new Capital Works.<br />
The expected capital and recurrent cost expenditures are presented in the following<br />
spreadsheets and shown graphically. Projections are in real (2006) dollars.<br />
<strong>Mid</strong>-<strong>Western</strong> <strong>Regional</strong> <strong>Council</strong> Part C - Detailed Information Page 85<br />
Strategic Business Plan for Sewerage
Page 86 Part C - Detailed Information <strong>Mid</strong>-<strong>Western</strong> <strong>Regional</strong> <strong>Council</strong><br />
Strategic Business Plan for Sewerage
Figure 12 - Detailed Capital Works Schedule for Sewerage<br />
<strong>Mid</strong>-<strong>Western</strong> <strong>Regional</strong> <strong>Council</strong> Part C - Detailed Information Page 87<br />
Strategic Business Plan for Sewerage
Figure 13 - Detailed Recurrent Cost Schedule for Sewerage<br />
Page 88 Part C - Detailed Information <strong>Mid</strong>-<strong>Western</strong> <strong>Regional</strong> <strong>Council</strong><br />
Strategic Business Plan for Sewerage
Figure 14 - Capital Works Plan for Sewerage<br />
12,000<br />
Real $ (000)<br />
10,000<br />
8,000<br />
6,000<br />
4,000<br />
Growth and Minor New Works<br />
Improved Levels of Service<br />
Asset Renewals<br />
2,000<br />
0<br />
2006/07<br />
2007/08<br />
2008/09<br />
2009/10<br />
2010/11<br />
2011/12<br />
2012/13<br />
2013/14<br />
2014/15<br />
2015/16<br />
2016/17<br />
2017/18<br />
2018/19<br />
2019/20<br />
2020/21<br />
2021/22<br />
2022/23<br />
2023/24<br />
2024/25<br />
2025/26<br />
2026/27<br />
2027/28<br />
2028/29<br />
2029/30<br />
2030/31<br />
2031/32<br />
2032/33<br />
2033/34<br />
2034/35<br />
2035/36<br />
Financial Year<br />
Figure 15 – Recurrent Cost Plan for Sewerage<br />
6,000<br />
5,000<br />
4,000<br />
Depreciation<br />
Management<br />
Operations & Maintenance<br />
Real $ (000)<br />
3,000<br />
2,000<br />
1,000<br />
0<br />
2006/07<br />
2007/08<br />
2008/09<br />
2009/10<br />
2010/11<br />
2011/12<br />
2012/13<br />
2013/14<br />
2014/15<br />
2015/16<br />
2016/17<br />
2017/18<br />
2018/19<br />
2019/20<br />
2020/21<br />
2021/22<br />
2022/23<br />
Financial Year<br />
2023/24<br />
2024/25<br />
2025/26<br />
2026/27<br />
2027/28<br />
2028/29<br />
2029/30<br />
2030/31<br />
2031/32<br />
2032/33<br />
2033/34<br />
2034/35<br />
2035/36<br />
<strong>Mid</strong>-<strong>Western</strong> <strong>Regional</strong> <strong>Council</strong> Part C - Detailed Information Page 89<br />
Strategic Business Plan for Sewerage
Figure 16 - Sewerage Capital Works Summary<br />
2006/07 $<br />
(000)<br />
Growth and<br />
Minor Works<br />
Improved<br />
Levels of<br />
Service<br />
Asset<br />
Renewals<br />
Total Capital<br />
Works<br />
Expected<br />
Subsidy<br />
Cost to<br />
<strong>Council</strong><br />
2006/07 65 350 399 814 88 726<br />
2007/08 66 3,000 322 3,388 750 2,638<br />
2008/09 6 11,000 324 11,330 2,750 8,580<br />
2009/10 6 2,000 326 2,332 0 2,332<br />
2010/11 156 6,000 328 6,484 0 6,484<br />
2011/12 0 0 335 335 0 335<br />
2012/13 210 1,300 335 1,845 0 1,845<br />
2013/14 (190) 0 335 145 0 145<br />
2014/15 10 0 335 345 0 345<br />
2015/16 10 0 335 345 0 345<br />
2016/17 60 0 335 395 0 395<br />
2017/18 60 300 335 695 0 695<br />
2018/19 10 3,500 335 3,845 0 3,845<br />
2019/20 10 3,500 335 3,845 0 3,845<br />
2020/21 10 2,300 335 2,645 0 2,645<br />
2021/22 10 2,200 335 2,545 0 2,545<br />
2022/23 10 0 335 345 0 345<br />
2023/24 10 0 335 345 0 345<br />
2024/25 10 0 335 345 0 345<br />
2025/26 10 3,000 335 3,345 0 3,345<br />
2026/27 60 0 335 395 0 395<br />
2027/28 60 0 335 395 0 395<br />
2028/29 10 0 335 345 0 345<br />
2029/30 10 0 335 345 0 345<br />
2030/31 10 0 335 345 0 345<br />
2031/32 10 0 335 345 0 345<br />
2032/33 10 0 335 345 0 345<br />
2033/34 10 0 335 345 0 345<br />
2034/35 10 0 335 345 0 345<br />
2035/36 10 0 335 345 0 345<br />
Total 739 38,450 10,074 49,263 3,588 45,675<br />
Page 90 Part C - Detailed Information <strong>Mid</strong>-<strong>Western</strong> <strong>Regional</strong> <strong>Council</strong><br />
Strategic Business Plan for Sewerage
Financial Modelling Outcomes<br />
Contains a summary of the financial modelling assumptions and outcomes<br />
Results of Modelling Process<br />
In line with current DWE guidelines, the financial plan identifies the lowest stable typical<br />
residential bill required with maximum utilisation of existing cash reserves. Financial<br />
projections have been made considering that subsidy as expected by <strong>Council</strong> will be<br />
available for the capital works during the forecast period.<br />
Financial modelling has demonstrated that typical residential bills, measured in 2006<br />
dollars, have to be increased to $490 p.a. from the present (2007/08) level of $460 p.a.<br />
from year 2008/09 onwards throughout the plan period as major capital works are planned<br />
during the next five years. This level of charges is sufficient to maintain liquidity with a<br />
minimum of $ 1000,000 of cash in hand over the period. A graphical presentation of the<br />
typical bills forecast is shown below.<br />
Figure 17 - Typical Residential Bill for Sewerage<br />
500<br />
490<br />
490<br />
490<br />
490<br />
490<br />
490<br />
490<br />
480<br />
Real $<br />
470<br />
460<br />
460<br />
450<br />
2006/07<br />
2007/08<br />
2008/09<br />
2009/10<br />
2010/11<br />
2011/12<br />
2012/13<br />
2013/14<br />
2014/15<br />
2015/16<br />
2016/17<br />
2017/18<br />
2018/19<br />
2019/20<br />
2020/21<br />
2021/22<br />
2022/23<br />
2023/24<br />
2024/25<br />
2025/26<br />
2026/27<br />
2027/28<br />
2028/29<br />
2029/30<br />
2030/31<br />
2031/32<br />
2032/33<br />
2033/34<br />
2034/35<br />
2035/36<br />
Financial Year<br />
All the renewal capital works will be internally funded throughout the projection period.<br />
Capital expenditure for major growth works planned for the next 15 years will be through<br />
mix of internal funds, government subsidy and external borrowing with the maximum<br />
utilisation of existing cash reserves and revenues.<br />
<strong>Mid</strong>-<strong>Western</strong> <strong>Regional</strong> <strong>Council</strong> Part C - Detailed Information Page 91<br />
Strategic Business Plan for Sewerage
The borrowing outstanding is expected to reach a peak of $ 12,606 K in 2021/22. but can<br />
be fully retired, if so required by <strong>Council</strong>, towards the end of the 30-year plan period. The<br />
levels of cash and borrowing outstanding during the forecast period are depicted in the<br />
following Figure. A summary of projected financial results is presented in the following<br />
Table.<br />
Figure 18 - Cash and Borrowing Projection for Sewerage<br />
9,000<br />
14,000<br />
7,500<br />
12,000<br />
Cash and Investment $(000)<br />
6,000<br />
4,500<br />
3,000<br />
Cash and Investments<br />
Minimum Cash Level ($1,000 K)<br />
Borrowing Outstanding<br />
10,000<br />
8,000<br />
6,000<br />
4,000<br />
Borrowing OUtstanding $(000)<br />
1,500<br />
2,000<br />
0<br />
2006/07<br />
2007/08<br />
2008/09<br />
2009/10<br />
2010/11<br />
2011/12<br />
2012/13<br />
2013/14<br />
2014/15<br />
2015/16<br />
2016/17<br />
2017/18<br />
2018/19<br />
2019/20<br />
2020/21<br />
2021/22<br />
2022/23<br />
2023/24<br />
2024/25<br />
2025/26<br />
2026/27<br />
2027/28<br />
2028/29<br />
2029/30<br />
2030/31<br />
2031/32<br />
2032/33<br />
2033/34<br />
2034/35<br />
2035/36<br />
0<br />
Financial Year<br />
Page 92 Part C - Detailed Information <strong>Mid</strong>-<strong>Western</strong> <strong>Regional</strong> <strong>Council</strong><br />
Strategic Business Plan for Sewerage
Figure 19 - Projected Financial Results for Sewerage<br />
2006/07<br />
($000)<br />
Revenue and Expenses<br />
Capital<br />
Transactions<br />
Financial Position<br />
System Assets<br />
Financial Year<br />
Total Revenue<br />
Total Expenses<br />
Operating Result (Before Grants)<br />
Acquisition of Assets<br />
Principal Loan Payments<br />
Cash and Investments<br />
Borrowings<br />
Total Assets<br />
Total Liabilities<br />
Net Assets Committed<br />
Current Replacement Cost<br />
Less: Accumulated Depreciation<br />
Written Down Current Cost<br />
Typical Residential Bills<br />
2006/07 3,482 2,829 653 814 53 6,483 909 25,537 1,033 24,504 41,775 22,826 18,949 460<br />
2007/08 4,150 3,069 1,082 3,388 53 4,873 979 26,528 1,105 25,423 44,841 23,292 21,549 460<br />
2008/09 6,463 3,445 3,018 11,330 170 1,747 5,330 33,787 5,459 28,328 55,847 23,915 31,932 490<br />
2009/10 3,712 3,524 188 2,332 215 1,814 6,460 35,213 6,592 28,621 57,853 24,564 33,288 490<br />
2010/11 3,929 4,060 (131) 6,484 376 1,836 11,896 40,663 12,037 28,626 64,009 25,300 38,710 490<br />
2011/12 4,006 4,084 (78) 335 388 2,045 11,161 40,147 11,305 28,842 64,009 26,028 37,981 490<br />
2012/13 4,077 4,148 (71) 1,845 428 1,729 11,408 40,592 11,556 29,036 65,519 26,779 38,740 490<br />
2013/14 4,161 4,142 20 145 442 2,195 10,634 40,123 10,784 29,339 65,329 27,526 37,803 490<br />
2014/15 4,250 4,143 107 345 459 2,517 9,865 39,710 10,018 29,692 65,339 28,273 37,065 490<br />
2015/16 4,335 4,142 193 345 474 2,902 9,104 39,361 9,261 30,100 65,349 29,020 36,328 490<br />
2016/17 4,392 4,170 222 395 490 3,239 8,349 39,012 8,508 30,504 65,409 29,768 35,641 490<br />
2017/18 4,462 4,143 319 695 509 3,349 7,597 38,731 7,759 30,972 65,769 30,521 35,248 490<br />
2018/19 4,505 4,330 175 3,845 581 2,240 8,895 40,332 9,060 31,272 69,278 31,323 37,955 490<br />
2019/20 4,534 4,534 0 3,845 587 1,433 10,549 42,184 10,717 31,467 72,788 32,176 40,612 490<br />
2020/21 4,580 4,681 (100) 2,645 662 1,206 11,580 43,383 11,750 31,633 75,098 33,063 42,035 490<br />
2021/22 4,634 4,856 (223) 2,546 737 1,021 12,606 44,492 12,779 31,713 77,309 33,981 43,328 490<br />
2022/23 4,696 4,797 (102) 345 763 1,036 11,476 43,601 11,651 31,950 77,319 34,900 42,419 490<br />
2023/24 4,761 4,768 (7) 345 790 1,119 10,352 42,778 10,530 32,248 77,329 35,819 41,510 490<br />
2024/25 4,823 4,738 85 345 818 1,263 9,233 42,015 9,413 32,602 77,339 36,738 40,601 490<br />
2025/26 4,881 4,944 (63) 3,345 923 1,193 11,042 43,996 11,224 32,772 80,349 37,700 42,649 490<br />
2026/27 4,942 4,936 6 395 954 1,115 9,766 43,017 9,951 33,066 80,409 38,663 41,747 490<br />
2027/28 5,007 4,863 144 395 979 1,153 8,502 42,153 8,690 33,463 80,470 39,627 40,843 490<br />
2028/29 5,077 4,824 253 345 782 1,544 7,472 41,593 7,662 33,931 80,479 40,590 39,889 490<br />
2029/30 5,152 4,800 352 345 735 2,071 6,520 41,169 6,713 34,456 80,490 41,554 38,936 490<br />
2030/31 5,238 4,782 456 345 457 2,966 5,874 41,112 6,069 35,043 80,500 42,517 37,982 490<br />
2031/32 5,322 4,815 507 345 472 3,869 5,230 41,063 5,428 35,635 80,509 43,481 37,028 490<br />
2032/33 5,409 4,780 629 345 439 4,902 4,639 41,144 4,840 36,304 80,520 44,445 36,075 490<br />
2033/34 5,492 4,781 712 345 454 5,973 4,050 41,262 4,253 37,009 80,529 45,409 35,120 490<br />
2034/35 5,579 4,781 798 345 469 7,082 3,463 41,420 3,668 37,752 80,539 46,373 34,166 490<br />
2035/36 5,666 4,784 883 345 486 8,228 2,876 41,614 3,084 38,530 80,549 47,337 33,213 490<br />
Sensitivity Analysis<br />
In accordance with the DWE Financial Guidelines, the following sensitivities have been<br />
modelled to determine the impact of various scenarios on typical residential bill for<br />
sewerage.<br />
Criteria Preferred Case Sensitivity<br />
Growth Rate 1.7% p.a. 0.9% p.a.<br />
Interest Rates<br />
Borrow @ 6.5% and<br />
invest @ 5.5%<br />
Borrow @ 9% and<br />
invest @ 8%<br />
Subsidy As expected by <strong>Council</strong> No Subsidy<br />
The results of modelling are presented in both graphic and tabular form. Note that the<br />
cash and borrowings are similar in most years to facilitate comparability between cases.<br />
<strong>Mid</strong>-<strong>Western</strong> <strong>Regional</strong> <strong>Council</strong> Part C - Detailed Information Page 93<br />
Strategic Business Plan for Sewerage
Figure 20 - Sensitivity of Typical Residential Bill for Sewerage<br />
550<br />
525<br />
518<br />
Real $ (000)<br />
500<br />
510<br />
490<br />
Sensitivity - 50% of Estimated Growth Rate<br />
475<br />
Sensitivity - No Subsidy<br />
Sensitivity - Borrow @ 9% and Invest @ 8%<br />
Preferred Case<br />
460<br />
450<br />
2006/07<br />
2007/08<br />
2008/09<br />
2009/10<br />
2010/11<br />
2011/12<br />
2012/13<br />
2013/14<br />
2014/15<br />
2015/16<br />
2016/17<br />
2017/18<br />
2018/19<br />
2019/20<br />
2020/21<br />
2021/22<br />
2022/23<br />
2023/24<br />
2024/25<br />
2025/26<br />
2026/27<br />
2027/28<br />
2028/29<br />
2029/30<br />
2030/31<br />
2031/32<br />
2032/33<br />
2033/34<br />
2034/35<br />
2035/36<br />
Financial Year<br />
Figure 21 - Sensitivity of Cash Levels for Sewerage<br />
10,000<br />
Real $ (000)<br />
8,000<br />
6,000<br />
4,000<br />
2,000<br />
0<br />
2006/07<br />
Sensitivity - No Subsidy<br />
Sensitivity - 50% of Estimated Growth Rate<br />
Sensitivity - Borrow @ 9% and Invest @ 8%<br />
Preferred Case<br />
Minimum Cash Level ($1,000 K)<br />
2007/08<br />
2008/09<br />
2009/10<br />
2010/11<br />
2011/12<br />
2012/13<br />
2013/14<br />
2014/15<br />
2015/16<br />
2016/17<br />
2017/18<br />
2018/19<br />
2019/20<br />
2020/21<br />
2021/22<br />
2022/23<br />
2023/24<br />
2024/25<br />
2025/26<br />
2026/27<br />
2027/28<br />
2028/29<br />
2029/30<br />
2030/31<br />
2031/32<br />
2032/33<br />
2033/34<br />
2034/35<br />
2035/36<br />
Financial Year<br />
Page 94 Part C - Detailed Information <strong>Mid</strong>-<strong>Western</strong> <strong>Regional</strong> <strong>Council</strong><br />
Strategic Business Plan for Sewerage
Figure 22 - Sensitivity on Borrowing Levels for Sewerage<br />
16,000<br />
14,000<br />
12,000<br />
Real $ (000)<br />
10,000<br />
8,000<br />
6,000<br />
4,000<br />
2,000<br />
Sensitivity - No Subsidy<br />
Sensitivity - Borrow @ 9% and Invest @ 8%<br />
Sensitivity - 50% of Estimated Growth Rate<br />
Preferred Case<br />
0<br />
2006/07<br />
2007/08<br />
2008/09<br />
2009/10<br />
2010/11<br />
2011/12<br />
2012/13<br />
2013/14<br />
2014/15<br />
2015/16<br />
2016/17<br />
2017/18<br />
2018/19<br />
2019/20<br />
2020/21<br />
2021/22<br />
2022/23<br />
2023/24<br />
2024/25<br />
2025/26<br />
2026/27<br />
2027/28<br />
2028/29<br />
2029/30<br />
2030/31<br />
2031/32<br />
2032/33<br />
2033/34<br />
2034/35<br />
2035/36<br />
Financial Year<br />
Figure 23 - Effect of Sensitivity on the Typical Residential Bill for Sewerage<br />
30<br />
25<br />
20<br />
Real $<br />
15<br />
10<br />
Sensitivity - 50% of Estimated Growth Rate<br />
Sensitivity - No Subsidy<br />
Sensitivity - Borrow @ 9% and Invest @ 8%<br />
Preferred Case<br />
5<br />
0<br />
2006/<br />
07<br />
2007/<br />
08<br />
2008/<br />
09<br />
2009/<br />
10<br />
2010/<br />
11<br />
2011/<br />
12<br />
2012/<br />
13<br />
2013/<br />
14<br />
2014/<br />
15<br />
2015/<br />
16<br />
2016/<br />
17<br />
2017/<br />
18<br />
Sensitivity - 50% of Estimated Growth Rate 0 0 28 28 28 28 28 28 28 28 28 28 28 28 28 28 28 28 28 28 28 28 28 28 28 28 28 28 28 28<br />
Sensitivity - No Subsidy 0 0 28 28 28 28 28 28 28 28 28 28 28 28 28 28 28 28 28 28 28 28 28 28 28 28 28 28 28 28<br />
Sensitivity - Borrow @ 9% and Invest @ 8% 0 0 20 20 20 20 20 20 20 20 20 20 20 20 20 20 20 20 20 20 20 20 20 20 20 20 20 20 20 20<br />
Preferred Case 0 0 0 0 0 0 0 0 0 0 0 0 0 0 0 0 0 0 0 0 0 0 0 0 0 0 0 0 0 0<br />
2018/<br />
19<br />
Financial Year<br />
Sensitivity analysis indicates that the typical residential bill is highly sensitive to all the<br />
considered parameters (growth rate, interest rate and subsidy). Note that growth rate and<br />
no subsidy scenarios have the same effect on the customer bills.<br />
2019/<br />
20<br />
2020/<br />
21<br />
2021/<br />
22<br />
2022/<br />
23<br />
2023/<br />
24<br />
2024/<br />
25<br />
2025/<br />
26<br />
2026/<br />
27<br />
2027/<br />
28<br />
2028/<br />
29<br />
2029/<br />
30<br />
2030/<br />
31<br />
2031/<br />
32<br />
2032/<br />
33<br />
2033/<br />
34<br />
2034/<br />
35<br />
2035/<br />
36<br />
<strong>Mid</strong>-<strong>Western</strong> <strong>Regional</strong> <strong>Council</strong> Part C - Detailed Information Page 95<br />
Strategic Business Plan for Sewerage
Page 96 Part C - Detailed Information <strong>Mid</strong>-<strong>Western</strong> <strong>Regional</strong> <strong>Council</strong><br />
Strategic Business Plan for Sewerage
Operating Environment Review<br />
The delivery of sewerage services to the scheme’s customers is subject to a large number<br />
of constraints, requirements, guidelines and other factors, which collectively are referred<br />
to as the operating environment. As part of the business planning process, a review was<br />
carried out to examine how the surrounding environment impacts on <strong>Council</strong>’s operation<br />
of its sewerage schemes. The six major elements of the operating environment are<br />
shown in the chart below. Progressive review of these elements provides increasing<br />
definition of the operating environment.<br />
Service<br />
Delivery<br />
Institutional<br />
Framework<br />
Future<br />
Development<br />
Sewerage<br />
Scheme<br />
Legislative<br />
Framework<br />
Stakeholders<br />
Corporate<br />
Goals<br />
Institutional Arrangements<br />
There are several recognised options open to <strong>Council</strong> to structure its institutional<br />
arrangements. The purpose of this review is to anticipate change; to look ahead at<br />
possible future outcomes and ask what strengths should <strong>Council</strong> be developing so it can<br />
meet these challenges.<br />
The Federal Industry Commission Report on the Australian Water Industry indicated that<br />
there should be an efficient use of resources in the water industry – natural, physical and<br />
financial. Their 1992 recommendations were wide-ranging and covered matters such as<br />
pricing and structural reforms. This has been followed-up by the <strong>NSW</strong> <strong>Government</strong>’s<br />
Competition Policy and the Independent Pricing and Regulatory Tribunal’s Pricing<br />
Principles for Local Water Authorities. In addition, the Local <strong>Government</strong> Association has<br />
issued a guideline of self-regulation, which suggests ways <strong>Council</strong> can improve its service<br />
delivery.<br />
<strong>Mid</strong>-<strong>Western</strong> <strong>Regional</strong> <strong>Council</strong> Part C - Detailed Information Page 97<br />
Strategic Business Plan for Sewerage
The following options exist:<br />
Amalgamation: where <strong>Council</strong> would amalgamate its operations with those of<br />
surrounding <strong>Council</strong>s to form a single large organisation that would serve a wider regional<br />
area.<br />
Advantages<br />
• With the greater staff resources created as the result of amalgamation<br />
there would be more relief staff available and the opportunity for further<br />
staff developments<br />
• The skills possessed by the larger staff resource would enable an<br />
improvement to other <strong>Council</strong> services<br />
• With amalgamation the infrastructure for the provision of services is already<br />
in place.<br />
• Potential reduction in the provision of the service due to operational<br />
efficiencies<br />
Disadvantages<br />
• Conflict involved with setup of an amalgamated organisation<br />
• Continued sectional interests in the amalgamated organisation<br />
• The resulting larger organisation with a greater asset base would be a<br />
bigger target for litigation<br />
• The customer expectations from a larger organisation would be different<br />
<strong>Mid</strong>-<strong>Western</strong> <strong>Regional</strong> <strong>Council</strong> is surrounded by 8 other <strong>Council</strong>s (Bathurst, Lithgow,<br />
Liverpool Plains, Muswellbrook, Upper Hunter, Warrumbungle and Wellington). MWRC<br />
has been formed recently with the amalgamation of former Mudgee Shire <strong>Council</strong> with<br />
Rylstone and parts of Merriwa. While this has generally benefitted the community and the<br />
<strong>Council</strong>, no further amalgamation with the surrounding <strong>Council</strong>s is expected in future.<br />
County <strong>Council</strong>/ Business Clusters: where <strong>Council</strong> would amalgamate its water supply<br />
and/or sewerage services divisions with those of neighbouring <strong>Council</strong>s and set these<br />
divisions up as an independent organisation that would provide these services to a wider<br />
region.<br />
Advantages<br />
As for “Amalgamation”<br />
• A regional county <strong>Council</strong> for the provision of services would provide<br />
access to greater financial power<br />
Disadvantages<br />
As for “Amalgamation”<br />
• The formation of a County <strong>Council</strong> is an advanced option and as such the<br />
process involved in implementing the change would be complicated.<br />
<strong>Council</strong> does not see economies of scale and increased resource availability with this<br />
arrangement. The view is that it would offer no obvious benefits and may be more<br />
expensive and less effective in the long term than the existing scheme.<br />
Page 98 Part C - Detailed Information <strong>Mid</strong>-<strong>Western</strong> <strong>Regional</strong> <strong>Council</strong><br />
Strategic Business Plan for Sewerage
Commercialisation: where <strong>Council</strong> would operate on a commercial basis, ie. each aspect<br />
of <strong>Council</strong>’s operations would be self sustaining<br />
Advantages<br />
• Prices reflect costs<br />
• User pays reduces consumption<br />
Disadvantages<br />
• Not necessarily consumer friendly<br />
• Profit may be put before quality of service<br />
Water supply and Sewerage operation of the <strong>Council</strong> are currently operated as part of the<br />
Asset Management Division of the <strong>Council</strong>. These operations are already carried out on a<br />
commercial basis in accordance with DEUS Best Practice Management Guidelines.<br />
Corporatisation: where <strong>Council</strong> would set up its operations and register as a company.<br />
Advantages<br />
• A corporation has the advantage of limited liability<br />
Disadvantages<br />
• Reduced government control of standards may occur due to a change of<br />
focus in the organisation from technical aspects to financial aspects<br />
<strong>Council</strong> views this option is inappropriate because the size of their water supply and<br />
sewerage operations is too small and the revenues are below the $2 Million threshold for<br />
corporatisation as identified by the Competition Policy.<br />
Privatisation: where <strong>Council</strong> would sell off its complete structure (assets, interests, etc)<br />
to a private individual or company who would then operate as they saw fit.<br />
Advantages<br />
• Reduced staffing levels can be achieved<br />
• Access to financial power through private investors<br />
Disadvantages<br />
• Less motivation for community involvement and environment aspects<br />
• Encouraging other industries to provide a competitive market would not be<br />
a priority<br />
• Profits are put before quality<br />
• Not in for the long haul<br />
<strong>Council</strong> considers that this option is highly unlikely to be adopted due to the associated<br />
risks and difficulty in management.<br />
<strong>Mid</strong>-<strong>Western</strong> <strong>Regional</strong> <strong>Council</strong> Part C - Detailed Information Page 99<br />
Strategic Business Plan for Sewerage
The various institutional arrangements were rated on a scale of +1 (very possible) to –1<br />
(very unlikely) with the following ranks:<br />
Option<br />
Ranking<br />
Amalgamation -1<br />
County <strong>Council</strong> -1<br />
Commercialisation +1<br />
Corporatisation -1<br />
Privatisation -1<br />
<strong>Council</strong> looks favourably on the commercialisation model. Other options are either not<br />
preferred or considered irrelevant under the prevailing operating environment.<br />
Legislative Framework<br />
Numerous Acts influence the way in which <strong>Council</strong> can provide sewerage services to the<br />
community. Appendix B provides a discussion of the relevant legislation and the specific<br />
implications it has for <strong>Council</strong>’s operations.<br />
Stakeholder Analysis<br />
The sewerage service must satisfy the needs of several stakeholder groups including<br />
customers, visitors, commerce and industry, and government. Appendix C examines<br />
these groups and evaluates <strong>Council</strong>’s current performance. In general <strong>Council</strong> is<br />
performing well with the exception of perceived high tariff by customers.<br />
The primary objective of <strong>Council</strong> is to provide a sustainable high level of service.<br />
Service Provision<br />
The sewerage system will need to be augmented and maintained to cope with growth,<br />
aging assets and increasing usage. Currently <strong>Council</strong> is not planning to service any<br />
additional areas outside the current designated service areas in Mudgee, Gulgong,<br />
Rylstone and Kandos. Charbon and Clandulla villages are likely to be provided with<br />
sewerage services in future.<br />
Page 100 Part C - Detailed Information <strong>Mid</strong>-<strong>Western</strong> <strong>Regional</strong> <strong>Council</strong><br />
Strategic Business Plan for Sewerage
Corporate Policies and Practices<br />
<strong>Mid</strong>-<strong>Western</strong> <strong>Regional</strong> <strong>Council</strong> currently has the following corporate policies that have an<br />
impact on the operation of the sewerage scheme.<br />
Corporate Policies<br />
Ensure that services provided are in<br />
accordance with the requirements set by<br />
<strong>Council</strong><br />
−<br />
−<br />
Impacts<br />
Reliable and consistent service<br />
Customer consultation<br />
Support OH&S and EEO principles − Socially responsible<br />
Construction over council assets not<br />
permitted<br />
−<br />
Asset Management<br />
Asset management policy − Asset Management<br />
Septic waste dipsosal policy (draft) − Environmental Management<br />
Trade waste policy (under development) − Sewer Load Management<br />
Developers contribution policy (detailed in<br />
DSPs) for sewerage<br />
−<br />
Improved levels of service<br />
Service Delivery<br />
Institutional arrangements are being reviewed throughout the State and initiatives such as<br />
the National Competition Policy and Self Regulation are currently being reviewed. The<br />
National Competition Policy’s impact on <strong>Mid</strong>-<strong>Western</strong> <strong>Regional</strong> <strong>Council</strong>’s future service<br />
delivery is minimal. Classed as a Category 2 business, the operation of the water supply<br />
and sewerage section is not seen as distortionary on competition at a state or national<br />
level. The separation of <strong>Council</strong>’s sewerage business from other activities is at the<br />
discretion of <strong>Council</strong>. The requirement of full cost attribution for sewerage service is<br />
already in place.<br />
The General Manager delegates authority to the Group Manager – Assets who in turn<br />
delegates the responsibility to Water Cycle and Waste Engineer to manage all the water<br />
supply and sewerage assets.<br />
The operation, maintenance and construction of assets are contracted to <strong>Mid</strong>-<strong>Western</strong><br />
Operations, an internal service provider. <strong>Mid</strong>-<strong>Western</strong> Operations has 23 staff, who<br />
operate and maintain the water supply and sewerage schemes.<br />
<strong>Mid</strong>-<strong>Western</strong> <strong>Regional</strong> <strong>Council</strong> Part C - Detailed Information Page 101<br />
Strategic Business Plan for Sewerage
<strong>Council</strong> has considered various methods of service delivery including the following:<br />
Full Service Contract<br />
Advantages<br />
• There is the possibility that the operation of the sewerage system would be<br />
lower under a full service contract due to the competitive aspect of letting a<br />
contract.<br />
• There would be a reduction in the staff required by <strong>Council</strong> to manage the<br />
sewerage operations.<br />
• There could possibly be a productivity improvement resulting from the<br />
competitive aspect of letting the full service contract.<br />
• There would be a transfer of the risk associated with operating the<br />
sewerage system.<br />
• Attractive for high-end technology operations.<br />
Disadvantages<br />
• As a result of having all operations under a full service contract <strong>Council</strong><br />
would lose some of the control and flexibility it currently has over the<br />
operations of the sewerage services.<br />
• By having the operations of the sewerage system on a full service contract<br />
there is the possibility of having profits put ahead of customers.<br />
• There would be a different set of problems associated with the<br />
management of the full service contract.<br />
• Requires a complete culture change.<br />
<strong>Council</strong> operates under a ‘purchaser-provider’ model whereby asset operations,<br />
maintenance and construction are undertaken by <strong>Mid</strong>-<strong>Western</strong> Operations, an internal<br />
service provider.<br />
Part Service Contract<br />
Advantages<br />
• Some degree of control over the sewerage operations can be retained.<br />
• The part service contract is carried out in a specialist area therefore<br />
providing the best service.<br />
• Ability to segment and assess current practises/performance<br />
Disadvantages<br />
• There would be a loss of expertise in specialist areas<br />
• <strong>Council</strong> would become reliant on the availability of specialists for work in<br />
these areas.<br />
• Possibility that profit would be put before customer service.<br />
• A comprehensive maintenance management system and information would<br />
be required.<br />
Page 102 Part C - Detailed Information <strong>Mid</strong>-<strong>Western</strong> <strong>Regional</strong> <strong>Council</strong><br />
Strategic Business Plan for Sewerage
<strong>Council</strong> carries out the majority of work in-house, particularly day-to-day operation and<br />
maintenance work. Some items of work which are contracted out include:<br />
• Water and effluent quality testing and calibration;<br />
• Operator training;<br />
• Telemetry upgrade;<br />
• CCTV<br />
• Pipe relining<br />
• Mechanical maintenance;<br />
• Strategic advice such as EIA, EMP, Best Practice Plans, OH&S audit etc.;<br />
• Specialist contract staff for specific purposes; and<br />
• Major engineering design and capital works (traditionally done in<br />
conjunction with the State Authorities and by tendered contract).<br />
<strong>Council</strong> will continue with the current practice and will monitor the situation with a view to<br />
assess the need for considering other options for contract services.<br />
B.O.O.T. (Build, Own, Operate and Transfer)<br />
Advantages<br />
• No large up front capital investment by the <strong>Council</strong> is required.<br />
• The risk involved with the construction of new capital works is transferred.<br />
• At the end of the B.O.O.T. period the <strong>Council</strong> is left with the asset.<br />
• Has potential for cost effectiveness.<br />
Disadvantages<br />
• The political and operational implications may be severe if the operator fails<br />
to perform satisfactorily or fails completely.<br />
• Ensuring appropriate processes and outcomes requires specialist<br />
expertise.<br />
• Community acceptance of the BOOT scheme may be hard to achieve<br />
• The developers profit and risk must be paid for as part of the overall project<br />
<strong>Council</strong> thinks that this option can be considered in future if subsidy or grants are not<br />
available for major capital works requiring huge capital investment. Currently there is no<br />
such capital work in the pipeline suitable for this type of service delivery.<br />
Resource Sharing<br />
Advantages<br />
• There would be a reduction in the number of resources required by <strong>Council</strong><br />
as these would be shared with the other organisations.<br />
• By sharing the resources associated with the provision of the sewerage<br />
services with other organisations economies of scale would be achieved.<br />
• May enables specialist expert team to be established and used on a<br />
regional basis.<br />
<strong>Mid</strong>-<strong>Western</strong> <strong>Regional</strong> <strong>Council</strong> Part C - Detailed Information Page 103<br />
Strategic Business Plan for Sewerage
Disadvantages<br />
• The co-ordination and commitment of other organisations is hard to get.<br />
Currently there are no resources that <strong>Council</strong> share with other organisations or parties.<br />
<strong>Council</strong> is open to consider this option if need arises.<br />
Conclusion<br />
The various service delivery arrangements were rated on a scale of +1 (very possible) to<br />
–1 (very unlikely) with the following ranks:<br />
Option<br />
Full Service Contract<br />
(Purchaser-Provider Model)<br />
Ranking<br />
+1<br />
Part-Service Contract +1<br />
BOOT 0<br />
Service Share 0<br />
As can be seen from the discussion <strong>Council</strong> sees that the Purchaser – Provider model<br />
and part service contract hold advantages to them.<br />
Therefore the present strategy is to continue with its current service delivery<br />
arrangements.<br />
Page 104 Part C - Detailed Information <strong>Mid</strong>-<strong>Western</strong> <strong>Regional</strong> <strong>Council</strong><br />
Strategic Business Plan for Sewerage
APPENDICES<br />
Appendix A<br />
Abbreviations<br />
Appendix B<br />
Legislative Framework<br />
Appendix C<br />
Stakeholder Review<br />
Appendix D<br />
Performance Indicators<br />
Appendix E<br />
Financial Input Data<br />
Appendix F<br />
Detailed Projected Financial Statements<br />
<strong>Mid</strong>-<strong>Western</strong> <strong>Regional</strong> <strong>Council</strong><br />
Strategic Business Plan for Sewerage<br />
Appendices
Appendices<br />
<strong>Mid</strong>-<strong>Western</strong> <strong>Regional</strong> <strong>Council</strong><br />
Strategic Business Plan for Sewerage
The following list of abbreviations may be used in the Strategic Plan.<br />
Appendix A<br />
Abbreviations<br />
BOD<br />
CBD<br />
CC<br />
CRC<br />
CSO<br />
CWP<br />
DA<br />
DCP<br />
DEUS<br />
DoC<br />
DUAP<br />
DWE<br />
EEO<br />
EIS<br />
EP<br />
EPA<br />
ET<br />
LEP<br />
NFR<br />
NH&MRC/<br />
AWRC<br />
OROC<br />
SEPP<br />
STP<br />
WTP<br />
TCM<br />
WDCC<br />
Biochemical oxygen demand, a measure of ‘strength’ of organic pollutants<br />
in wastewater/ sewage.<br />
Central business district<br />
Construction certificate.<br />
Current replacement cost. The cost to replace existing assets with new<br />
assets that will provide the same service function.<br />
Community service obligation.<br />
Capital works program.<br />
Development application.<br />
Development control plan.<br />
Department of Energy, Utilities and Sustainability.<br />
Department of Commerce.<br />
Department of Urban Affairs and Planning.<br />
Department of Water and Energy.<br />
Equal Employment Opportunity.<br />
Environmental impact statement.<br />
Equivalent population.<br />
Environment Protection Authority.<br />
Equivalent tenements.<br />
Local environment plan.<br />
Non-filtrable residue (also refers to as suspended solids), a measure of<br />
fine particle pollutants in wastewater.<br />
National Health and Medical Research <strong>Council</strong> / Australian Water<br />
Research <strong>Council</strong>.<br />
Orana <strong>Regional</strong> Organisation of <strong>Council</strong>s<br />
State Environmental Planning Policy.<br />
Sewage treatment plant (also referred to as STW).<br />
Water treatment plant (also referred to as WFP).<br />
Total catchment management.<br />
Written down current cost. The current replacement cost less the<br />
accumulated depreciation to date.<br />
<strong>Mid</strong>-<strong>Western</strong> <strong>Regional</strong> <strong>Council</strong><br />
Strategic Business Plan for Sewerage<br />
Appendices
Appendices<br />
<strong>Mid</strong>-<strong>Western</strong> <strong>Regional</strong> <strong>Council</strong><br />
Strategic Business Plan for Sewerage
Appendix B<br />
Legislation Affecting<br />
Sewerage Services<br />
Legislative Framework<br />
<strong>Mid</strong>-<strong>Western</strong> <strong>Regional</strong> <strong>Council</strong> delivers water supply and sewerage services services for<br />
Mudgee, Gulgong, Rylstone and Kandos under the authority of the Local <strong>Government</strong> Act,<br />
1993. <strong>Council</strong> has embraced the principles underlying this Act as being of benefit to the<br />
community it serves. Community consultation and involvement in decision-making has<br />
been increased in line with the Act in the last few years.<br />
Several other acts also affect <strong>Council</strong>’s scheme. These generally fall into three main<br />
categories as follows:<br />
1. Pricing<br />
Act<br />
General Implications for <strong>Council</strong><br />
Local <strong>Government</strong> Act 1993<br />
Esp. Sections 64 and 428<br />
Determining developer charges:<br />
−<br />
provide a source of funding for infrastructure<br />
required for new urban development<br />
− provide signals regarding costs of urban<br />
development and encourage less costly forms<br />
Need to be more accountable.<br />
Need for better asset management.<br />
Environmental Planning and<br />
Assessment Act 1979<br />
Determining developer charges.<br />
Requirement for LEP and DCP’s.<br />
<strong>Council</strong> control of service approvals.<br />
Water Management Act 2000<br />
Progressively replaces the<br />
previous Water Act 1912, Water<br />
Authorities Act 1987 and 10 others<br />
including irrigation, rivers and<br />
foreshores Acts)<br />
Local <strong>Government</strong> Regulation 1993<br />
(Savings and Transitional)<br />
Determining developer charges.<br />
Water rights, licences, allocations.<br />
Determining developer charges.<br />
<strong>Mid</strong>-<strong>Western</strong> <strong>Regional</strong> <strong>Council</strong><br />
Strategic Business Plan for Sewerage<br />
Appendices
Independent Pricing and<br />
Regulatory Tribunal Act 1992<br />
Gives powers to the Independent Pricing and<br />
Regulatory Tribunal to inquire into and regulate<br />
prices.<br />
IPART has developed a set of consistent pricing<br />
principles to be adopted by local government<br />
authorities.<br />
Charging guidelines.<br />
Trend towards a user pay system in the industry.<br />
2. Environmental Protection<br />
Protection of the Environment<br />
Operations Act 1997<br />
Brings together:<br />
- Clean Air Act 1961<br />
- Clean Waters Act 1970<br />
Regulating pollution activities and issue of<br />
licenses as well as the monitoring of and reporting<br />
on waste output.<br />
<strong>Council</strong> is required to be “duly diligent” in<br />
undertaking the scheme operations.<br />
- Pollution Control Act 1970<br />
- Noise Control Act 1975<br />
- Environmental Offences and<br />
Penalties (EOP) Act 1989<br />
Soil Conservation Act 1938 Conserves soil resources and farm water<br />
resources and the mitigation of erosion and land<br />
degradation.<br />
Preservation of watercourse environments.<br />
Environmental Planning and<br />
Assessment Act 1979<br />
Catchment Management Act 1989<br />
Encourages the proper management of natural<br />
and man-made resources, the orderly use of land,<br />
the provision of services and protection of the<br />
environment.<br />
Promotes the coordination of activities within<br />
catchment areas. <strong>Council</strong> believes this Act has<br />
implications for the management of river water<br />
quality and quantity.<br />
Requirement for ongoing management plan.<br />
Requirement of Capital Works Plan under Sydney<br />
Catchment Authority Regulations.<br />
Water Management Act 2000<br />
The act provides for sustainable and integrated<br />
management of <strong>NSW</strong>’s water sources.<br />
Water rights, licences, allocations.<br />
Appendices<br />
<strong>Mid</strong>-<strong>Western</strong> <strong>Regional</strong> <strong>Council</strong><br />
Strategic Business Plan for Sewerage
3. Health and Safety<br />
Public Health Act 1991<br />
Prevention of the spread of disease.<br />
Effluent disposal methods.<br />
Delivery of quality water.<br />
Occupational Health and Safety<br />
Act 2000 (and Regulations 2001)<br />
<strong>Council</strong>’s responsibility to ensure health, safety<br />
and welfare of employees and others at places of<br />
work.<br />
Likely be cost implications<br />
Impacts all operations.<br />
Note public safety – insurance.<br />
Local <strong>Government</strong> Act 1993<br />
<strong>Council</strong> delivers sewerage services to its residents via authority delegated under the Local<br />
<strong>Government</strong> Act 1993. The Minister for Energy, Utilities and Sustainability administers the<br />
parts of this Act dealing with sewerage.<br />
The Act confers service functions on councils. These include the provision, management<br />
and operation of sewerage works and facilities. The Act provides <strong>Council</strong>s with broad<br />
powers to carry out their functions, and a "<strong>Council</strong> may do all such things as are<br />
supplemented or incidental to, or consequential on, the exercise of its functions" (section<br />
23 of the Act).<br />
Some particular parts of the Act relating to sewerage are:<br />
• Section 64 - developer chargers. (Under this section of the new Act, a<br />
<strong>Council</strong> may use the relevant provisions of the Water Supply Authorities<br />
Act to obtain water supply and sewerage developer charges. The<br />
provisions of Section 94 of the Environmental Planning and Assessment<br />
Act are no longer available to councils for obtaining sewerage developer<br />
contributions);<br />
• Section 68 - <strong>Council</strong> approval of plumbing works;<br />
• Sections 634-651 - water supply, sewerage and drainage offences; and<br />
• Water, Sewerage and Drainage Regulations, which cover matters from the<br />
"old" ordinance 45 and 46.<br />
The role of the Minister for Public Works in regard to water supply, sewerage and<br />
drainage as covered in Sections 56-66, has now passed to the Minister of Energy, Utilities<br />
and Sustainability. The Minister's role is generally along the lines of Part XIV of the 1919<br />
Act, and it includes matters such as construction of works, hand over and vesting of work,<br />
approval of dams and treatment plants, directions to councils concerning dams and<br />
treatment plants, action during emergencies, and the appointment of an administrator.<br />
Environmental Planning and Assessment Act 1979<br />
This Act is the principal planning instrument in <strong>NSW</strong>, and it specifies the environmental<br />
considerations required in all development activities. It also governs the procedures of all<br />
proposals that have an effect on the environment. Its objectives are to encourage the<br />
proper management of natural and man-made resources, the orderly use of land, the<br />
provision of services, and the protection of the environment.<br />
<strong>Mid</strong>-<strong>Western</strong> <strong>Regional</strong> <strong>Council</strong><br />
Strategic Business Plan for Sewerage<br />
Appendices
The Act is administered by the Minister for Planning.<br />
The Act requires that all proposals, activities, and functions which are investigated,<br />
designed, planned, constructed, and operated by councils should be studied during all<br />
stages for their environmental impact on the basis of scale, location and performance.<br />
Catchment Management Act 1989<br />
The objectives of this Act are:<br />
• To coordinate policies, programs and activities as they relate to total<br />
catchment management;<br />
• To achieve active community participation in natural resource<br />
management;<br />
• To identify and rectify natural resource degradation;<br />
• To promote the sustainable use of natural resources; and<br />
• To provide stable and productive soil, high quality water and protective and<br />
productive soil and vegetation cover within each of the State's water<br />
catchments.<br />
The Act is administered by the Minister for Energy, Utilities and Sustainability.<br />
Any works planned and undertaken by this Committee are subject to normal planning<br />
approval. It has no authority over <strong>Council</strong>.<br />
Soil Conservation Act 1938<br />
The objective of the Soil Conservation Act is the conservation of soil resources and farm<br />
water resources and the mitigation of erosion and land degradation.<br />
The Act is administered by the Minister for Energy, Utilities and Sustainability.<br />
Public Health Act 1991<br />
The Public Health Act 1991 consolidates previous Acts relating to Public Health and<br />
provides for the prevention of the spread of disease.<br />
The Act is administered by the Minister for Health.<br />
Under Section 14 of the Act, the Director-General or any authorised officer of the<br />
Department of Health may inspect sewerage works where the Director-General deems it<br />
necessary in the interest of public health. The Director-General may report to the Minister<br />
for Energy, Utilities and Sustainability whenever any danger to public health could be<br />
removed or diminished. The Minister may then take appropriate action.<br />
Public Works Act 1912<br />
This Act provides the authority for the Department of Energy, Utilities and Sustainability to<br />
construct water supply and sewerage works within the <strong>Council</strong>’s area.<br />
The powers of the Minister for Public Works, particularly with respect to acquisition of land<br />
for water and sewerage works have been transferred to the Minister for Energy, Utilities<br />
and Sustainability.<br />
Appendices<br />
<strong>Mid</strong>-<strong>Western</strong> <strong>Regional</strong> <strong>Council</strong><br />
Strategic Business Plan for Sewerage
Water Management Act 2000<br />
Replaces the previous Water Act 1912, Water Authorities Act 1987 and 10 other Acts<br />
(including irrigation, rivers and foreshore acts).<br />
This Act, administered by the Minister for Energy, Utilities and Sustainability, covers<br />
matters such as water rights licences, water allocation, water sharing as well as<br />
recognition of water for environmental health requirements.<br />
Details have been set out in “Developer Charges Guidelines for Water Supply, Sewerage<br />
and Stormwater” pursuant to section 306 (3) of the Water Management Act 2000. <strong>Council</strong><br />
should consider these guidelines previously issued by the Minister for Land and Water<br />
Conservation, who is now the Minister of Energy, Utilities and Sustainability.<br />
Independent Pricing and Regulatory Tribunal Act 1992<br />
The Independent Pricing and Regulatory Tribunal (IPART, previously <strong>Government</strong> Pricing<br />
Tribunal) was set up to determine and advise prices and pricing policies for government<br />
monopoly services.<br />
The Tribunal currently has powers to set prices for Sydney Water, Hunter Water and<br />
Gosford and Wyong <strong>Council</strong>s. This includes service usage charges and developer<br />
contributions.<br />
The Tribunal does not intend, in the near term, to regulate prices for water supply and<br />
sewerage services in country <strong>NSW</strong>. Instead it has recently released Pricing Principles for<br />
Local Water Authorities which sets out pricing recommendations for <strong>Council</strong>’s to adopt in<br />
the pricing of their services.<br />
Occupational Health and Safety Act 2000<br />
This revised Act details <strong>Council</strong>'s responsibilities to ensure health, safety and welfare of<br />
employees and others at places of work. All of the scheme's operational activities are<br />
impacted on by this Act. This act is administered by the WorkCover Authority.<br />
Protection of the Environment Operations Act<br />
This Act came into effect in July 1998 and consolidated existing legislation to eradicate<br />
the duplication of powers and overlapping use of resources.<br />
The Act brought together what used to be five separate pieces of legislation:<br />
• Clean Air Act 1961;<br />
• Clean Waters Act 1970;<br />
• Pollution Control Act 1970;<br />
• Noise Control Act 1975; and<br />
• Environmental Offences and Penalties Act 1989.<br />
The legislation also incorporates major regulatory provisions of the Waste Minimisation<br />
and Management Act.<br />
<strong>Mid</strong>-<strong>Western</strong> <strong>Regional</strong> <strong>Council</strong><br />
Strategic Business Plan for Sewerage<br />
Appendices
Other <strong>Government</strong> Initiatives<br />
Efficient Operation<br />
Federal <strong>Government</strong><br />
Competition Policy<br />
Asset Management<br />
Financial<br />
Assistance<br />
Pricing and<br />
Developer Charges<br />
The Department of Local <strong>Government</strong> is concerned that councils<br />
generally are well managed.<br />
The Federal Industry Commission Report on the Australian Water<br />
Industry is concerned to ensure efficient use of resources -<br />
natural, physical and financial. Its 1992 Report's<br />
recommendations were wide-ranging and covered matters such<br />
as pricing reforms and structural reforms (eg amalgamation of<br />
authorities).<br />
In 1995 the <strong>Council</strong> of Australian <strong>Government</strong>s (COAG) ratified<br />
the National Competition Policy. Of particular significance to the<br />
water and sewerage functions of <strong>Council</strong> is the application of<br />
competitive neutrality to operations. The purpose of this is tho<br />
have councils “operate under similar competitive pressures to<br />
those experienced by the private sector”.<br />
The <strong>NSW</strong> <strong>Government</strong> has embraced these principles and set in<br />
motion a number of policies to increase the efficiency and the<br />
competitiveness of this type of business area. (Refer to the <strong>NSW</strong><br />
<strong>Government</strong> Policy Statement on the Application of National<br />
Competition Policy to Local <strong>Government</strong>.)<br />
The <strong>NSW</strong> <strong>Government</strong>, which has ultimate responsibility for water<br />
and sewerage in the State, is concerned to ensure that the $7<br />
billion asset base in country towns water supply and sewerage<br />
schemes under the care of Local <strong>Government</strong>, is well managed.<br />
The <strong>NSW</strong> <strong>Government</strong> has been providing grants for the<br />
development and improvement of water supply and sewerage<br />
schemes in country areas, under the Country Towns Water,<br />
Sewerage and Drainage Program which is now administered by<br />
the Department of Energy, Utilities and Sustainability.<br />
The Minister for Energy, Utilities and Sustainability has made<br />
changes to the subsidy provisions. The main changes are the<br />
requirement to implement best industry management practices<br />
and the withdrawal of subsidies for growth related capital works.<br />
These changes are outlined in the publication Country Towns<br />
Water Supply and Sewerage Program: Technical and Financial<br />
Assistance Available to <strong>Council</strong>s.<br />
In July 1993, a new Local <strong>Government</strong> Act was enacted. Section<br />
64 of the new act specifies that councils apply development<br />
contributions in accordance with the provisions of the Water<br />
Supply Authorities Act. Section 25 (formerly under Section 27<br />
which no longer exists) of that act authorises the water authority<br />
to levy a charge on a developer towards the cost of works serving<br />
the development. These works may be existing, projected, or<br />
both.<br />
Guidelines are issued from time to time by the Minister for<br />
Energy, Utilities and Sustainability. These guidelines, which<br />
include a methodology for calculating development contributions,<br />
were issued in February 2003.<br />
Appendices<br />
<strong>Mid</strong>-<strong>Western</strong> <strong>Regional</strong> <strong>Council</strong><br />
Strategic Business Plan for Sewerage
Best Practice<br />
Management<br />
The <strong>NSW</strong> <strong>Government</strong> encourages best practice for all LWUs.<br />
The purpose of best practice management is:<br />
To encourage the effective and efficient delivery of water supply<br />
and sewerage services; and<br />
To promote sustainable water conservation practices and water<br />
demand management throughout <strong>NSW</strong>.<br />
From 1 July 2004, compliance with the six best practice criteria is<br />
mandatory for payment of a dividend from the surplus of an<br />
LWU’s water supply and sewerage businesses and future<br />
financial assistance under the Country Towns Water Supply &<br />
Sewerage (CTWS&S) program.<br />
<strong>Mid</strong>-<strong>Western</strong> <strong>Regional</strong> <strong>Council</strong><br />
Strategic Business Plan for Sewerage<br />
Appendices
Appendices<br />
<strong>Mid</strong>-<strong>Western</strong> <strong>Regional</strong> <strong>Council</strong><br />
Strategic Business Plan for Sewerage
Appendix C<br />
Stakeholder Review<br />
Stakeholders are individuals and organisations with an interest and/or equity in the<br />
sewerage services provided by <strong>Council</strong>. Stakeholders have different expectations, and<br />
the extent to which <strong>Council</strong> meets these expectations varies.<br />
Institutional Stakeholders<br />
A large number of government departments and agencies have interest in, and impact on,<br />
the management of the sewerage scheme, as shown in the chart below.<br />
Regulators<br />
<strong>Council</strong><br />
State<br />
<strong>Government</strong><br />
Resource<br />
Managers<br />
Sewerage<br />
Scheme<br />
Efficiency<br />
Federal<br />
<strong>Government</strong><br />
Assistance<br />
Local <strong>Government</strong><br />
The sewerage undertakings are an integral part of <strong>Council</strong>’s operation. <strong>Council</strong> has the<br />
ultimate responsibility for the development, operations, maintenance and performance of<br />
the sewerage scheme. As the owner of the undertaking, <strong>Council</strong> is also responsible for<br />
any liability of the sewerage scheme.<br />
State <strong>Government</strong><br />
The State <strong>Government</strong> has a significant impact on the sewerage scheme. Various<br />
government agencies fill a role in one or more of the following areas.<br />
Regulators<br />
These are the agencies who are largely responsible for administering the various acts<br />
listed in the preceding section. Of particular significance to the sewerage scheme are the<br />
Independent Pricing and Regulatory Tribunal (IPART), which is urging councils to adopt<br />
the pricing principles outlined in Pricing Principles for Local Water Authorities, and the<br />
Environment Protection Authority (EPA) who regulates environmental protection, issues<br />
licences to discharge effluent and administers the various pollution control acts. <strong>Council</strong><br />
discharges effluent from sewage treatment plants under licence from the EPA.<br />
The Department of Energy, Utilities and Sustainability, while nominally a resource<br />
manager, has a special role in the development of water supply and sewerage schemes,<br />
setting standards and guidelines and administering the <strong>Government</strong> grants program (refer<br />
below).<br />
<strong>Mid</strong>-<strong>Western</strong> <strong>Regional</strong> <strong>Council</strong><br />
Strategic Business Plan for Sewerage<br />
Appendices
Resource Managers<br />
These are the agencies responsible for managing the State’s resources, such as water<br />
resources, forestry and land.<br />
Assistance<br />
The State <strong>Government</strong> has been providing financial and administrative assistance for<br />
improvements of water supply and sewerage schemes through the Country Towns Water,<br />
Sewerage and Drainage Program. Under the newly introduced guidelines, assistance is<br />
generally available for servicing backlog areas and improving standards, but not for<br />
augmentation works required to accommodate growth. This program is administered by<br />
the Department of Energy, Utilities and Sustainability.<br />
Other assistance is in the form of services, such as the professional services provided by<br />
the Department of Commerce.<br />
Federal <strong>Government</strong><br />
The Federal <strong>Government</strong> has no direct bearing on the sewerage schemes. Indirectly, the<br />
Federal <strong>Government</strong> is taking the initiative on reforming the way services are delivered to<br />
the community by <strong>Government</strong> agencies in order to improve efficiency.<br />
Stakeholder Analysis<br />
Stakeholders are individuals and organisations with an interest and/or equity in the<br />
sewerage services provided by <strong>Council</strong>. Stakeholders have different expectations, and<br />
the extent to which <strong>Council</strong> meets these expectations varies.<br />
The Table next page lists the major stakeholders, their general expectations and the<br />
comments of <strong>Council</strong>’s as to the standing of sewerage operations.<br />
Appendices<br />
<strong>Mid</strong>-<strong>Western</strong> <strong>Regional</strong> <strong>Council</strong><br />
Strategic Business Plan for Sewerage
Stakeholder How to judge success How does<br />
<strong>Council</strong> rate its<br />
service<br />
1 – Poor<br />
10 - Excellent<br />
General Users<br />
How do<br />
stakeholders<br />
rate the service<br />
1 – Poor<br />
10 - Excellent<br />
Property Owners/<br />
Ratepayers<br />
−<br />
−<br />
Rates/ value for money<br />
Levels of Service<br />
M/G - 8<br />
R/K - 6<br />
6<br />
5<br />
Residents/<br />
Families<br />
−<br />
−<br />
Quality services<br />
Public health standards met<br />
and maintained<br />
M/G - 8<br />
R/K - 6<br />
6<br />
5<br />
−<br />
Guaranteed service<br />
−<br />
Reasonable cost<br />
−<br />
Palatability of water<br />
Pensioners − Rebates<br />
−<br />
−<br />
−<br />
−<br />
−<br />
Quality services<br />
Public health standards met<br />
and maintained<br />
Guaranteed service<br />
Reasonable cost<br />
Palatability of water<br />
M/G - 8<br />
R/K - 6<br />
6<br />
5<br />
Commercial and<br />
Industrial<br />
customers<br />
−<br />
−<br />
−<br />
Quality<br />
Sufficient supply<br />
Guaranteed service<br />
M/G - 8<br />
R/K - 6<br />
8<br />
8<br />
−<br />
Reasonable cost<br />
Other Users<br />
Downstream<br />
water users<br />
(Irrigators)<br />
−<br />
−<br />
−<br />
Clean quality water<br />
Continued supply<br />
No future interference with<br />
their operations<br />
6 (nutrients in<br />
effluent)<br />
8<br />
Environmental<br />
groups<br />
−<br />
−<br />
Environmental responsibility<br />
Minimisation of wastage<br />
6 (nutrients in<br />
effluent)<br />
8<br />
−<br />
Environmental sustainability<br />
Tourists − Quality and quantity of<br />
service<br />
−<br />
Aesthetics<br />
9 9<br />
<strong>Mid</strong>-<strong>Western</strong> <strong>Regional</strong> <strong>Council</strong><br />
Strategic Business Plan for Sewerage<br />
Appendices
Stakeholder How to judge success How does<br />
<strong>Council</strong> rate its<br />
service<br />
1 – Poor<br />
10 - Excellent<br />
<strong>Council</strong><br />
How do<br />
stakeholders<br />
rate the service<br />
1 – Poor<br />
10 - Excellent<br />
<strong>Council</strong>lors − No complaints<br />
<strong>Council</strong><br />
employees<br />
Engineering<br />
Services<br />
Department<br />
<strong>Government</strong><br />
−<br />
−<br />
−<br />
−<br />
−<br />
−<br />
−<br />
−<br />
−<br />
−<br />
−<br />
−<br />
−<br />
−<br />
−<br />
−<br />
−<br />
Good public profile<br />
Security of supply<br />
Compliance<br />
Continued availability<br />
Price<br />
Recognition for work<br />
Safe workplace<br />
Competency/training<br />
Security<br />
Pride in workplace/<br />
schemes<br />
Support<br />
Efficient service<br />
Chargeable service<br />
Working relationship<br />
Timeliness<br />
Innovation and technology<br />
Informed advice<br />
M/G - 8<br />
6<br />
R/K - 6<br />
5<br />
8 6<br />
8 6<br />
DLG − Accountability<br />
−<br />
Financial stability<br />
DEUS − Efficient operations<br />
−<br />
−<br />
Performance<br />
Best practice management<br />
DEC /EPA − Environmental requirements<br />
Others<br />
(Dept. of Health,<br />
Work Cover etc.)<br />
−<br />
−<br />
−<br />
Sludge disposal<br />
Water quality<br />
Catchment management<br />
Note: M – Mudgee; G – Gulgong; R – Rylstone; and K – Kandos<br />
8 8<br />
7 7<br />
6 6<br />
8 8<br />
Appendices<br />
<strong>Mid</strong>-<strong>Western</strong> <strong>Regional</strong> <strong>Council</strong><br />
Strategic Business Plan for Sewerage
Appendix D<br />
Performance Indicators<br />
<strong>Mid</strong>-<strong>Western</strong> <strong>Regional</strong> <strong>Council</strong> has been submitting performance information about its<br />
sewerage scheme to the Department of Energy, Utilities and Sustainability for inclusion in<br />
its annual State-wide performance reports. This will allow <strong>Council</strong> to compare its system<br />
against equivalent councils and then undertake benchmarking to identify items and<br />
methods for future improvement. A Triple Bottom Line (TBL) approach has been adopted<br />
to collate the information.<br />
Performance Indicators<br />
Following comments can be made when comparing <strong>Council</strong>’s sewerage scheme to the<br />
rest in the State:<br />
☺<br />
− New sewerage connections to <strong>Council</strong>’s sewerage scheme is slightly<br />
above the 2005/06 State median level<br />
−<br />
Typical residential bill for sewerage has been slightly above the State<br />
median level<br />
−<br />
<strong>Council</strong> has low sewerage developer charges that is below State average<br />
☺<br />
− Number of odour complaints have reduced during the last two-years with<br />
no complaints being reported<br />
<br />
− While <strong>Council</strong> is fully compliant with BOD in DEC licence conditions,<br />
some level of non-compliance has been reported with regard to SS<br />
(suspended solids) in the discharges<br />
<br />
− Number of sewer main chokes and collapses shows an increasing trend,<br />
but remained slightly below State average in 2005/06<br />
<br />
− Operating and treatment costs show an increasing trend and are slightly<br />
above State average for the last two years<br />
☺<br />
− <strong>Council</strong>’s management cost for sewerage scheme is at par with State<br />
average<br />
☺<br />
− <strong>Council</strong> is among top 20% of councils with low pumping costs<br />
<strong>Mid</strong>-<strong>Western</strong> <strong>Regional</strong> <strong>Council</strong><br />
Strategic Business Plan for Sewerage<br />
Appendices
Appendices<br />
<strong>Mid</strong>-<strong>Western</strong> <strong>Regional</strong> <strong>Council</strong><br />
Strategic Business Plan for Sewerage
Appendix E<br />
Financial Input Data<br />
Details of data input to the financial model are presented in the following pages.<br />
<strong>Mid</strong>-<strong>Western</strong> <strong>Regional</strong> <strong>Council</strong><br />
Strategic Business Plan for Sewerage<br />
Appendices
MWRC Sewer Fund Financial Model - 2006-07 : Preferred Case<br />
Historical Operating Statement<br />
FINMOD<br />
DEPARTMENT OF<br />
COMMERCE<br />
EXPENSES<br />
2004/05* 2005/06*<br />
Management Expenses 642 676<br />
Administration 642 676<br />
Engineering and Supervision 0 0<br />
Operation and Maintenance Expenses 1095 1214<br />
Operation Expenses 102 53<br />
Maintenance Expenses 950 1123<br />
Energy Costs 43 38<br />
Chemical Costs 0 0<br />
Depreciation 771 746<br />
System Assets 698 717<br />
Plant & Equipment 73 29<br />
Interest Expenses 0 0<br />
Other Expenses 0 0<br />
TOTAL EXPENSES 2508 2636<br />
REVENUES<br />
Rates & Service Availability Charges 2465 2751<br />
Residential 2365 2371<br />
Non-Residential 100 380<br />
Trade Waste Charges 116 0<br />
Other Sales and Charges 0 0<br />
Extra Charges 0 0<br />
Interest Income 215 273<br />
Other Revenues 0 0<br />
Grants 96 70<br />
Grants for Acquisition of Assets 32 8<br />
Pensioner Rebate Subsidy 64 62<br />
Other Grants 0 0<br />
Contributions 340 275<br />
Developer Charges 340 275<br />
Developer Provided Assets 0 0<br />
Other Contributions 0 0<br />
TOTAL REVENUES 3232 3369<br />
OPERATING RESULT 724 733<br />
OPERATING RESULT (less Grants for Acq of<br />
Assets)<br />
692 725<br />
Printed 5/03/2008 Values in $'000<br />
Page 1
MWRC Sewer Fund Financial Model - 2006-07 : Preferred Case<br />
Historical Statement of Financial Position<br />
FINMOD<br />
DEPARTMENT OF<br />
COMMERCE<br />
2004/05* 2005/06*<br />
Cash and Investments 5934<br />
Receivables 83<br />
Inventories 17<br />
Property, Plant & Equipment 0 18330<br />
System Assets (1) 18330<br />
Plant & Equipment 0<br />
Other Assets 0<br />
TOTAL ASSETS 0 24364<br />
LIABILITIES<br />
Bank Overdraft 0<br />
Creditors 13<br />
Borrowings 945<br />
Provisions 105<br />
TOTAL LIABILITIES 0 1063<br />
NET ASSETS COMMITTED 0 23301<br />
EQUITY<br />
Accumulated Operating Result 23301<br />
Asset Revaluation Reserve 0<br />
TOTAL EQUITY 0 23301<br />
(1) Notes to System Assets<br />
Current Replacement Cost 40155<br />
Less: Accumulated Depreciation 0 21825<br />
Written Down Current Cost 18330<br />
Printed 5/03/2008 Values in $'000<br />
Page 2
MWRC Sewer Fund Financial Model - 2006-07 : Preferred Case<br />
Base Forecast Data<br />
FINMOD<br />
DEPARTMENT OF<br />
COMMERCE<br />
2006/07 2007/08 2008/09 2009/10 2010/11 2011/12 2012/13 2013/14 2014/15 2015/16 2016/17 2017/18 2018/19 2019/20 2020/21 2021/22 2022/23 2023/24 2024/25 2025/26 2026/27 2027/28 2028/29 2029/30 2030/31<br />
Financial Data<br />
Inflation Rate - General (%) 3.00 3.00 3.00<br />
3.00<br />
3.00<br />
3.00<br />
3.00<br />
3.00<br />
3.00<br />
3.00<br />
3.00<br />
3.00<br />
3.00<br />
3.00<br />
3.00<br />
3.00<br />
3.00<br />
3.00<br />
3.00<br />
3.00<br />
3.00<br />
3.00<br />
3.00 3.00<br />
3.00<br />
Inflation Rate - Capital Works (%) 3.00 3.00 3.00<br />
3.00<br />
3.00<br />
3.00<br />
3.00<br />
3.00<br />
3.00<br />
3.00<br />
3.00<br />
3.00<br />
3.00<br />
3.00<br />
3.00<br />
3.00<br />
3.00<br />
3.00<br />
3.00<br />
3.00<br />
3.00<br />
3.00<br />
3.00 3.00<br />
3.00<br />
Borrowing Interest Rate for New Loans (%) 6.50 6.50 6.50<br />
6.50<br />
6.50<br />
6.50<br />
6.50<br />
6.50<br />
6.50<br />
6.50<br />
6.50<br />
6.50<br />
6.50<br />
6.50<br />
6.50<br />
6.50<br />
6.50<br />
6.50<br />
6.50<br />
6.50<br />
6.50<br />
6.50<br />
6.50 6.50<br />
6.50<br />
Investment Interest Rate (%) 5.50 5.50 5.50<br />
5.50<br />
5.50<br />
5.50<br />
5.50<br />
5.50<br />
5.50<br />
5.50<br />
5.50<br />
5.50<br />
5.50<br />
5.50<br />
5.50<br />
5.50<br />
5.50<br />
5.50<br />
5.50<br />
5.50<br />
5.50<br />
5.50<br />
5.50 5.50<br />
5.50<br />
Number of Assessments<br />
Growth Rate (%)<br />
Residential Assessments 1.18 1.17 1.16<br />
2.43<br />
7.29<br />
2.21<br />
2.16<br />
2.11<br />
2.03<br />
1.99<br />
1.95<br />
1.91<br />
1.87<br />
1.81<br />
1.75<br />
1.70<br />
1.64<br />
1.59<br />
1.54<br />
1.50<br />
1.45<br />
1.40<br />
1.36 1.34<br />
1.33<br />
Non-Residential Assessments 2.35 2.29 2.24<br />
2.19<br />
2.15<br />
2.10<br />
2.06<br />
2.02<br />
1.98<br />
1.94<br />
1.90<br />
1.87<br />
1.83<br />
0.69<br />
0.69<br />
0.68<br />
0.68<br />
0.67<br />
0.67<br />
0.66<br />
0.66<br />
0.66<br />
0.65 0.65<br />
0.64<br />
Total Assessments 1.29 1.27 1.26<br />
2.40<br />
6.81<br />
2.20<br />
2.15<br />
2.11<br />
2.02<br />
1.98<br />
1.94<br />
1.91<br />
1.87<br />
1.71<br />
1.66<br />
1.61<br />
1.56<br />
1.51<br />
1.47<br />
1.43<br />
1.38<br />
1.34<br />
1.30 1.29<br />
1.27<br />
Number of New Assessments<br />
Residential 66 66 66<br />
140<br />
431<br />
140<br />
140<br />
140<br />
137<br />
137<br />
137<br />
137<br />
137<br />
135<br />
133<br />
131<br />
129<br />
127<br />
125<br />
123<br />
121<br />
119<br />
117 117<br />
117<br />
Non-Residential 13 13 13<br />
13<br />
13<br />
13<br />
13<br />
13<br />
13<br />
13<br />
13<br />
13<br />
13<br />
5<br />
5<br />
5<br />
5<br />
5<br />
5<br />
5<br />
5<br />
5<br />
5 5<br />
5<br />
Total New Assessments 79 79 79<br />
153<br />
444<br />
153<br />
153<br />
153<br />
150<br />
150<br />
150<br />
150<br />
150<br />
140<br />
138<br />
136<br />
134<br />
132<br />
130<br />
128<br />
126<br />
124<br />
122 122<br />
122<br />
Projected Number of Assessments<br />
Residential 5639 5705 5771<br />
5911<br />
6342<br />
6482<br />
6622<br />
6762<br />
6899<br />
7036<br />
7173<br />
7310<br />
7447<br />
7582<br />
7715<br />
7846<br />
7975<br />
8102<br />
8227<br />
8350<br />
8471<br />
8590<br />
8707 8824<br />
8941<br />
Non-Residential 567 580 593<br />
606<br />
619<br />
632<br />
645<br />
658<br />
671<br />
684<br />
697<br />
710<br />
723<br />
728<br />
733<br />
738<br />
743<br />
748<br />
753<br />
758<br />
763<br />
768<br />
773 778<br />
783<br />
Total Projected Assessments 6206 6285 6364<br />
6517<br />
6961<br />
7114<br />
7267<br />
7420<br />
7570<br />
7720<br />
7870<br />
8020<br />
8170<br />
8310<br />
8448<br />
8584<br />
8718<br />
8850<br />
8980<br />
9108<br />
9234<br />
9358<br />
9480 9602<br />
9724<br />
Backlog Assessments<br />
Residential 0 0 0<br />
0<br />
291<br />
0<br />
0<br />
0<br />
0<br />
0<br />
0<br />
0<br />
0<br />
0<br />
0<br />
0<br />
0<br />
0<br />
0<br />
0<br />
0<br />
0<br />
0 0<br />
0<br />
Non-Residential 0 0 0<br />
0<br />
0<br />
0<br />
0<br />
0<br />
0<br />
0<br />
0<br />
0<br />
0<br />
0<br />
0<br />
0<br />
0<br />
0<br />
0<br />
0<br />
0<br />
0<br />
0 0<br />
0<br />
Total Backlog Assessments 0 0 0<br />
0<br />
291<br />
0<br />
0<br />
0<br />
0<br />
0<br />
0<br />
0<br />
0<br />
0<br />
0<br />
0<br />
0<br />
0<br />
0<br />
0<br />
0<br />
0<br />
0 0<br />
0<br />
Developer Charges / Vacant Assessments (Values in 2006/07 $)<br />
Developer Charges $/Assessment<br />
Residential 1300 1300 2649<br />
2649<br />
2649<br />
2649<br />
2649<br />
2649<br />
2649<br />
2649<br />
2649<br />
2649<br />
2649<br />
2649<br />
2649<br />
2649<br />
2649<br />
2649<br />
2649<br />
2649<br />
2649<br />
2649<br />
2649 2649<br />
2649<br />
Non-Residential 1700 1700 3617<br />
3617<br />
3617<br />
3617<br />
3617<br />
3617<br />
3617<br />
3617<br />
3617<br />
3617<br />
3617<br />
3617<br />
3617<br />
3617<br />
3617<br />
3617<br />
3617<br />
3617<br />
3617<br />
3617<br />
3617 3617<br />
3617<br />
Number of Vacant Residential Assessments 167 167 167<br />
167<br />
167<br />
167<br />
167<br />
167<br />
167<br />
167<br />
167<br />
167<br />
167<br />
167<br />
167<br />
167<br />
167<br />
167<br />
167<br />
167<br />
167<br />
167<br />
167 167<br />
167<br />
Average Charge of Vacant Assessments 100 100 100<br />
100<br />
100<br />
100<br />
100<br />
100<br />
100<br />
100<br />
100<br />
100<br />
100<br />
100<br />
100<br />
100<br />
100<br />
100<br />
100<br />
100<br />
100<br />
100<br />
100 100<br />
100<br />
% of Occupied Assessments 0 0 0<br />
0<br />
0<br />
0<br />
0<br />
0<br />
0<br />
0<br />
0<br />
0<br />
0<br />
0<br />
0<br />
0<br />
0<br />
0<br />
0<br />
0<br />
0<br />
0<br />
0 0<br />
0<br />
Depreciation of Existing Plant and Equipment (Values in 2006/07 $'000)<br />
Current Replacement Cost of System Assets 41360<br />
Override<br />
Written Down Current Cost of System Assets 18880<br />
Override<br />
Annual Depreciation of Existing System Assets 739<br />
Override<br />
Written Down Value of Plant and Equipment 0<br />
Override<br />
Annual Depreciation of Existing Plant and<br />
Equipment<br />
0 0 0<br />
0<br />
0<br />
0<br />
0<br />
0<br />
0<br />
0<br />
0<br />
0<br />
0<br />
0<br />
0<br />
0<br />
0<br />
0<br />
0<br />
0<br />
0<br />
0<br />
0 0<br />
0<br />
Printed 5/03/2008 Values in $'000<br />
Page 3
MWRC Sewer Fund Financial Model - 2006-07 : Preferred Case<br />
Base Forecast Data<br />
FINMOD<br />
DEPARTMENT OF<br />
COMMERCE<br />
2006/07 2007/08 2008/09 2009/10 2010/11 2011/12 2012/13 2013/14 2014/15 2015/16 2016/17 2017/18 2018/19 2019/20 2020/21 2021/22 2022/23 2023/24 2024/25 2025/26 2026/27 2027/28 2028/29 2029/30 2030/31<br />
Existing Loan Payments (Values in Inflated $'000)<br />
Existing Loan Payments : Principal (Total:945) 53 51 54<br />
58<br />
62<br />
66<br />
70<br />
75<br />
80<br />
85<br />
91<br />
97<br />
103<br />
0<br />
0<br />
0<br />
0<br />
0<br />
0<br />
0<br />
0<br />
0<br />
0 0<br />
0<br />
Existing Loan Payments : Interest (Total:462) 55 57 54<br />
50<br />
47<br />
43<br />
38<br />
33<br />
28<br />
23<br />
18<br />
11<br />
5<br />
0<br />
0<br />
0<br />
0<br />
0<br />
0<br />
0<br />
0<br />
0<br />
0 0<br />
0<br />
Capital Works Program (Values in 2006/07 $'000)<br />
Subsidised Scheme (Total:38450) 350 <strong>3000</strong> 11000<br />
2000<br />
6000<br />
0<br />
1300<br />
0<br />
0<br />
0<br />
0<br />
300<br />
3500<br />
3500<br />
2300<br />
2200<br />
0<br />
0<br />
0<br />
<strong>3000</strong><br />
0<br />
0<br />
0 0<br />
0<br />
Other New System Assets (Total:739) 65 66 6<br />
6<br />
156<br />
0<br />
210<br />
-190<br />
10<br />
10<br />
60<br />
60<br />
10<br />
10<br />
10<br />
10<br />
10<br />
10<br />
10<br />
10<br />
60<br />
60<br />
10 10<br />
10<br />
Renewals (Total:10074) 399 322 324<br />
326<br />
328<br />
335<br />
335<br />
335<br />
335<br />
335<br />
335<br />
335<br />
335<br />
335<br />
335<br />
335<br />
335<br />
335<br />
335<br />
335<br />
335<br />
335<br />
335 335<br />
335<br />
Total Capital Works (Total:49263) 814 3388 11330<br />
2332<br />
6484<br />
335<br />
1845<br />
145<br />
345<br />
345<br />
395<br />
695<br />
3845<br />
3845<br />
2645<br />
2545<br />
345<br />
345<br />
345<br />
3345<br />
395<br />
395<br />
345 345<br />
345<br />
Grant For Acquisition of Assets (% of<br />
Subsidised Scheme)<br />
25.00 25.00 25.00<br />
0.00<br />
0.00<br />
0.00<br />
0.00<br />
0.00<br />
0.00<br />
0.00<br />
0.00<br />
0.00<br />
0.00<br />
0.00<br />
0.00<br />
0.00<br />
0.00<br />
0.00<br />
0.00<br />
0.00<br />
0.00<br />
0.00<br />
0.00 0.00<br />
0.00<br />
Grant For Acquisition of Assets ($) (Total:3588) 88 750 2750<br />
0<br />
0<br />
0<br />
0<br />
0<br />
0<br />
0<br />
0<br />
0<br />
0<br />
0<br />
0<br />
0<br />
0<br />
0<br />
0<br />
0<br />
0<br />
0<br />
0 0<br />
0<br />
Developer Provided Assets (Total:0) 0 0 0<br />
0<br />
0<br />
0<br />
0<br />
0<br />
0<br />
0<br />
0<br />
0<br />
0<br />
0<br />
0<br />
0<br />
0<br />
0<br />
0<br />
0<br />
0<br />
0<br />
0 0<br />
0<br />
Plant and Equipment Expenditure / Asset Disposal (Values in 2006/07 $'000)<br />
Plant and Equipment Expenditure 0 0 0<br />
0<br />
0<br />
0<br />
0<br />
0<br />
0<br />
0<br />
0<br />
0<br />
0<br />
0<br />
0<br />
0<br />
0<br />
0<br />
0<br />
0<br />
0<br />
0<br />
0 0<br />
0<br />
Proceeds from Disposal of Plant and Equipment 0 0 0<br />
0<br />
0<br />
0<br />
0<br />
0<br />
0<br />
0<br />
0<br />
0<br />
0<br />
0<br />
0<br />
0<br />
0<br />
0<br />
0<br />
0<br />
0<br />
0<br />
0 0<br />
0<br />
Written Down Value of Plant and Equipment<br />
Disposed<br />
0 0 0<br />
0<br />
0<br />
0<br />
0<br />
0<br />
0<br />
0<br />
0<br />
0<br />
0<br />
0<br />
0<br />
0<br />
0<br />
0<br />
0<br />
0<br />
0<br />
0<br />
0 0<br />
0<br />
Gain/Loss on Disposal of Plant and Equipment 0 0 0<br />
0<br />
0<br />
0<br />
0<br />
0<br />
0<br />
0<br />
0<br />
0<br />
0<br />
0<br />
0<br />
0<br />
0<br />
0<br />
0<br />
0<br />
0<br />
0<br />
0 0<br />
0<br />
Proceeds from Disposal of Assets 0 0 0<br />
0<br />
0<br />
0<br />
0<br />
0<br />
0<br />
0<br />
0<br />
0<br />
0<br />
0<br />
0<br />
0<br />
0<br />
0<br />
0<br />
0<br />
0<br />
0<br />
0 0<br />
0<br />
Written Down Value of Assets Disposed 0 0 0<br />
0<br />
0<br />
0<br />
0<br />
0<br />
0<br />
0<br />
0<br />
0<br />
0<br />
0<br />
0<br />
0<br />
0<br />
0<br />
0<br />
0<br />
0<br />
0<br />
0 0<br />
0<br />
Gain/Loss on Disposal of System Assets 0 0 0<br />
0<br />
0<br />
0<br />
0<br />
0<br />
0<br />
0<br />
0<br />
0<br />
0<br />
0<br />
0<br />
0<br />
0<br />
0<br />
0<br />
0<br />
0<br />
0<br />
0 0<br />
0<br />
Printed 5/03/2008 Values in $'000<br />
Page 4
MWRC Sewer Fund Financial Model - 2006-07 : Preferred Case<br />
Revised/Additional Forecast Data<br />
FINMOD<br />
DEPARTMENT OF<br />
COMMERCE<br />
2006/07 2007/08 2008/09 2009/10 2010/11 2011/12 2012/13 2013/14 2014/15 2015/16 2016/17 2017/18 2018/19 2019/20 2020/21 2021/22 2022/23 2023/24 2024/25 2025/26 2026/27 2027/28 2028/29 2029/30 2030/31<br />
OMA / Revenue Overrides (Values in 2006/07 $'000)<br />
Administration 705 714 723<br />
740<br />
790<br />
807<br />
824<br />
841<br />
858<br />
875<br />
892<br />
909<br />
926<br />
942<br />
958<br />
973<br />
988<br />
1003<br />
1018<br />
1033<br />
1047<br />
1061<br />
1075 1089<br />
1103<br />
Override 726 809 780<br />
669<br />
715<br />
756<br />
746<br />
762<br />
777<br />
792<br />
836<br />
823<br />
839<br />
853<br />
867<br />
912<br />
895<br />
908<br />
922<br />
935<br />
981<br />
961<br />
973 986<br />
998<br />
Engineering and Supervision 0 0 0<br />
0<br />
0<br />
0<br />
0<br />
0<br />
0<br />
0<br />
0<br />
0<br />
0<br />
0<br />
0<br />
0<br />
0<br />
0<br />
0<br />
0<br />
0<br />
0<br />
0 0<br />
0<br />
Override<br />
Operating Expenses 55 56 57<br />
58<br />
62<br />
63<br />
64<br />
65<br />
66<br />
67<br />
68<br />
69<br />
70<br />
71<br />
72<br />
73<br />
74<br />
75<br />
76<br />
77<br />
78<br />
79<br />
80 81<br />
82<br />
Override 65 117 72<br />
127<br />
79<br />
80<br />
82<br />
84<br />
86<br />
87<br />
89<br />
91<br />
92<br />
94<br />
96<br />
97<br />
99<br />
100<br />
102<br />
103<br />
104<br />
106<br />
107 109<br />
110<br />
Maintenance Expenses 1172 1187 1202<br />
1231<br />
1315<br />
1344<br />
1373<br />
1402<br />
1430<br />
1458<br />
1486<br />
1514<br />
1542<br />
1568<br />
1594<br />
1620<br />
1645<br />
1670<br />
1695<br />
1719<br />
1743<br />
1766<br />
1789 1812<br />
1835<br />
Override 1196 1247 1248<br />
1278<br />
1365<br />
1395<br />
1425<br />
1455<br />
1484<br />
1513<br />
1543<br />
1572<br />
1602<br />
1629<br />
1656<br />
1683<br />
1709<br />
1735<br />
1760<br />
1785<br />
1810<br />
1834<br />
1858 1882<br />
1906<br />
Energy Costs 40 41 42<br />
43<br />
46<br />
47<br />
48<br />
49<br />
50<br />
51<br />
52<br />
53<br />
54<br />
55<br />
56<br />
57<br />
58<br />
59<br />
60<br />
61<br />
62<br />
63<br />
64 65<br />
66<br />
Override<br />
Chemical Costs 0 0 0<br />
0<br />
0<br />
0<br />
0<br />
0<br />
0<br />
0<br />
0<br />
0<br />
0<br />
0<br />
0<br />
0<br />
0<br />
0<br />
0<br />
0<br />
0<br />
0<br />
0 0<br />
0<br />
Override<br />
Other Expenses 0 0 0<br />
0<br />
0<br />
0<br />
0<br />
0<br />
0<br />
0<br />
0<br />
0<br />
0<br />
0<br />
0<br />
0<br />
0<br />
0<br />
0<br />
0<br />
0<br />
0<br />
0 0<br />
0<br />
Override<br />
Other Revenue 0 0 0<br />
0<br />
0<br />
0<br />
0<br />
0<br />
0<br />
0<br />
0<br />
0<br />
0<br />
0<br />
0<br />
0<br />
0<br />
0<br />
0<br />
0<br />
0<br />
0<br />
0 0<br />
0<br />
Override<br />
Other Grants 0 0 0<br />
0<br />
0<br />
0<br />
0<br />
0<br />
0<br />
0<br />
0<br />
0<br />
0<br />
0<br />
0<br />
0<br />
0<br />
0<br />
0<br />
0<br />
0<br />
0<br />
0 0<br />
0<br />
Override<br />
Other Contributions 0 0 0<br />
0<br />
0<br />
0<br />
0<br />
0<br />
0<br />
0<br />
0<br />
0<br />
0<br />
0<br />
0<br />
0<br />
0<br />
0<br />
0<br />
0<br />
0<br />
0<br />
0 0<br />
0<br />
Override<br />
Developer Charges Overrides (Values in 2006/07 $'000)<br />
Calculated from Scheme Data 108 108 222<br />
418<br />
418<br />
418<br />
418<br />
418<br />
410<br />
410<br />
410<br />
410<br />
410<br />
376<br />
370<br />
365<br />
360<br />
355<br />
349<br />
344<br />
339<br />
333<br />
328 328<br />
328<br />
Override 204 204 418<br />
418<br />
418<br />
410<br />
410<br />
410<br />
410<br />
410<br />
376<br />
370<br />
365<br />
360<br />
355<br />
349<br />
344<br />
339<br />
333<br />
328<br />
328<br />
328<br />
328 328<br />
328<br />
Pensioner Rebate (Values in Inflated $)<br />
Pensioner Rebate per Pensioner ($) 87.50 87.50 87.50<br />
87.50<br />
87.50<br />
87.50<br />
87.50<br />
87.50<br />
87.50<br />
87.50<br />
87.50<br />
87.50<br />
87.50<br />
87.50<br />
87.50<br />
87.50<br />
87.50<br />
87.50<br />
87.50<br />
87.50<br />
87.50<br />
87.50<br />
87.50 87.50<br />
87.50<br />
Override<br />
Pensioner Rebate Subsidy (%) 55.00 55.00 55.00<br />
55.00<br />
55.00<br />
55.00<br />
55.00<br />
55.00<br />
55.00<br />
55.00<br />
55.00<br />
55.00<br />
55.00<br />
55.00<br />
55.00<br />
55.00<br />
55.00<br />
55.00<br />
55.00<br />
55.00<br />
55.00<br />
55.00<br />
55.00 55.00<br />
55.00<br />
Override<br />
Number of Pensioner Assessments 1303 1318 1334<br />
1366<br />
1466<br />
1498<br />
1530<br />
1563<br />
1594<br />
1626<br />
1658<br />
1689<br />
1721<br />
1752<br />
1783<br />
1813<br />
1843<br />
1872<br />
1901<br />
1930<br />
1958<br />
1985<br />
2012 2039<br />
2066<br />
Override<br />
Percentage of Pensioners (%) 23.11 23.11 23.11<br />
23.11<br />
23.11<br />
23.11<br />
23.11<br />
23.11<br />
23.11<br />
23.11<br />
23.11<br />
23.11<br />
23.11<br />
23.11<br />
23.11<br />
23.11<br />
23.11<br />
23.11<br />
23.11<br />
23.11<br />
23.11<br />
23.11<br />
23.11 23.11<br />
23.11<br />
Override<br />
Pensioner Rebate 114 115 117<br />
120<br />
128<br />
131<br />
134<br />
137<br />
139<br />
142<br />
145<br />
148<br />
151<br />
153<br />
156<br />
159<br />
161<br />
164<br />
166<br />
169<br />
171<br />
174<br />
176 178<br />
181<br />
Pensioner Rebate Subsidy 63 63 64<br />
66<br />
70<br />
72<br />
74<br />
75<br />
76<br />
78<br />
80<br />
81<br />
83<br />
84<br />
86<br />
87<br />
89<br />
90<br />
91<br />
93<br />
94<br />
96<br />
97 98<br />
100<br />
Revenue Split (%)<br />
Residential Rates 88.73 88.64 88.55<br />
88.57<br />
88.97<br />
88.98<br />
88.98<br />
88.99<br />
88.99<br />
89.00<br />
89.00<br />
89.01<br />
89.01<br />
89.10<br />
89.18<br />
89.25<br />
89.32<br />
89.39<br />
89.46<br />
89.52<br />
89.58<br />
89.63<br />
89.68 89.73<br />
89.78<br />
Override<br />
Non-Residential Rates 9.10 9.19 9.28<br />
9.26<br />
8.85<br />
8.84<br />
8.84<br />
8.83<br />
8.83<br />
8.82<br />
8.82<br />
8.81<br />
8.81<br />
8.72<br />
8.64<br />
8.56<br />
8.49<br />
8.42<br />
8.35<br />
8.29<br />
8.23<br />
8.17<br />
8.12 8.07<br />
8.02<br />
Override<br />
Trade Waste Charges 2.17 2.17 2.17<br />
2.17<br />
2.18<br />
2.18<br />
2.18<br />
2.18<br />
2.18<br />
2.18<br />
2.18<br />
2.18<br />
2.18<br />
2.18<br />
2.18<br />
2.19<br />
2.19<br />
2.19<br />
2.19<br />
2.19<br />
2.19<br />
2.20<br />
2.20 2.20<br />
2.20<br />
Override<br />
Other Sales and charges 0.00 0.00 0.00<br />
0.00<br />
0.00<br />
0.00<br />
0.00<br />
0.00<br />
0.00<br />
0.00<br />
0.00<br />
0.00<br />
0.00<br />
0.00<br />
0.00<br />
0.00<br />
0.00<br />
0.00<br />
0.00<br />
0.00<br />
0.00<br />
0.00<br />
0.00 0.00<br />
0.00<br />
Override<br />
Extra Charges 0.00 0.00 0.00<br />
0.00<br />
0.00<br />
0.00<br />
0.00<br />
0.00<br />
0.00<br />
0.00<br />
0.00<br />
0.00<br />
0.00<br />
0.00<br />
0.00<br />
0.00<br />
0.00<br />
0.00<br />
0.00<br />
0.00<br />
0.00<br />
0.00<br />
0.00 0.00<br />
0.00<br />
Override<br />
Total Non-Residential Revenue (%) 11.27 11.36 11.45<br />
11.43<br />
11.03<br />
11.02<br />
11.02<br />
11.01<br />
11.01<br />
11.00<br />
11.00<br />
10.99<br />
10.99<br />
10.90<br />
10.82<br />
10.75<br />
10.68<br />
10.61<br />
10.54<br />
10.48<br />
10.42<br />
10.37<br />
10.32 10.27<br />
10.22<br />
Total 100.00 100.00 100.00<br />
100.00<br />
100.00<br />
100.00<br />
100.00<br />
100.00<br />
100.00<br />
100.00<br />
100.00<br />
100.00<br />
100.00<br />
100.00<br />
100.00<br />
100.00<br />
100.00<br />
100.00<br />
100.00<br />
100.00<br />
100.00<br />
100.00<br />
100.00 100.00<br />
100.00<br />
Total Residential Revenue (%) 88.73 88.64 88.55<br />
88.57<br />
88.97<br />
88.98<br />
88.98<br />
88.99<br />
88.99<br />
89.00<br />
89.00<br />
89.01<br />
89.01<br />
89.10<br />
89.18<br />
89.25<br />
89.32<br />
89.39<br />
89.46<br />
89.52<br />
89.58<br />
89.63<br />
89.68 89.73<br />
89.78<br />
Printed 5/03/2008 Values in $'000<br />
Page 5
MWRC Sewer Fund Financial Model - 2006-07 : Preferred Case<br />
Revised/Additional Forecast Data<br />
FINMOD<br />
DEPARTMENT OF<br />
COMMERCE<br />
2006/07 2007/08 2008/09 2009/10 2010/11 2011/12 2012/13 2013/14 2014/15 2015/16 2016/17 2017/18 2018/19 2019/20 2020/21 2021/22 2022/23 2023/24 2024/25 2025/26 2026/27 2027/28 2028/29 2029/30 2030/31<br />
New Loan Payment Overrides (Values in Inflated $'000)<br />
Standard Loan Payments: Principal 0 4 126<br />
177<br />
361<br />
384<br />
441<br />
469<br />
501<br />
533<br />
568<br />
607<br />
725<br />
862<br />
1001<br />
1149<br />
1224<br />
1305<br />
1392<br />
1618<br />
1723<br />
1822<br />
1499 1450<br />
928<br />
Standard Loan Payments: Interest 2 12 324<br />
421<br />
844<br />
819<br />
871<br />
841<br />
813<br />
781<br />
743<br />
704<br />
858<br />
1050<br />
1186<br />
1330<br />
1256<br />
1175<br />
1089<br />
1337<br />
1230<br />
1117<br />
1004 908<br />
818<br />
Structured Loan Payments: Principal 0 0 0<br />
0<br />
0<br />
0<br />
0<br />
0<br />
0<br />
0<br />
0<br />
0<br />
0<br />
0<br />
0<br />
0<br />
0<br />
0<br />
0<br />
0<br />
0<br />
0<br />
0 0<br />
0<br />
Structured Loan Payments: Interest 0 0 0<br />
0<br />
0<br />
0<br />
0<br />
0<br />
0<br />
0<br />
0<br />
0<br />
0<br />
0<br />
0<br />
0<br />
0<br />
0<br />
0<br />
0<br />
0<br />
0<br />
0 0<br />
0<br />
Capitalised Interest 0 0 0<br />
0<br />
0<br />
0<br />
0<br />
0<br />
0<br />
0<br />
0<br />
0<br />
0<br />
0<br />
0<br />
0<br />
0<br />
0<br />
0<br />
0<br />
0<br />
0<br />
0 0<br />
0<br />
Total New Loan Payments: Principal 0 4 126<br />
177<br />
361<br />
384<br />
441<br />
469<br />
501<br />
533<br />
568<br />
607<br />
725<br />
862<br />
1001<br />
1149<br />
1224<br />
1305<br />
1392<br />
1618<br />
1723<br />
1822<br />
1499 1450<br />
928<br />
Override<br />
Total New Loan Payments: Interest 2 12 324<br />
421<br />
844<br />
819<br />
871<br />
841<br />
813<br />
781<br />
743<br />
704<br />
858<br />
1050<br />
1186<br />
1330<br />
1256<br />
1175<br />
1089<br />
1337<br />
1230<br />
1117<br />
1004 908<br />
818<br />
Override<br />
Capitalised Interest 0 0 0<br />
0<br />
0<br />
0<br />
0<br />
0<br />
0<br />
0<br />
0<br />
0<br />
0<br />
0<br />
0<br />
0<br />
0<br />
0<br />
0<br />
0<br />
0<br />
0<br />
0 0<br />
0<br />
Override<br />
Printed 5/03/2008 Values in $'000<br />
Page 6
Appendices<br />
<strong>Mid</strong>-<strong>Western</strong> <strong>Regional</strong> <strong>Council</strong><br />
Strategic Business Plan for Sewerage
Appendix F<br />
Detailed Projected<br />
Financial Statements<br />
Details of financial projections made using FINMOD financial model are presented in the<br />
following pages.<br />
<strong>Mid</strong>-<strong>Western</strong> <strong>Regional</strong> <strong>Council</strong><br />
Strategic Business Plan for Sewerage<br />
Appendices
MWRC Sewer Fund Financial Model - 2006-07 : Preferred Case<br />
Operating Statement<br />
FINMOD<br />
DEPARTMENT OF<br />
COMMERCE<br />
EXPENSES<br />
2006/07 2007/08 2008/09 2009/10 2010/11 2011/12 2012/13 2013/14 2014/15 2015/16 2016/17 2017/18 2018/19 2019/20 2020/21 2021/22 2022/23 2023/24 2024/25 2025/26 2026/27 2027/28 2028/29 2029/30 2030/31<br />
Management Expenses 726 809 780 669 715 756 746 762 777 792 836 823 839<br />
853<br />
867 912 895 908 922 935 981 961 973 986 998<br />
Administration 726 809 780<br />
669<br />
715<br />
756<br />
746<br />
762<br />
777<br />
792<br />
836<br />
823<br />
839<br />
853<br />
867<br />
912<br />
895<br />
908<br />
922<br />
935<br />
981<br />
961<br />
973 986<br />
998<br />
Engineering and Supervision 0 0 0<br />
0<br />
0<br />
0<br />
0<br />
0<br />
0<br />
0<br />
0<br />
0<br />
0<br />
0<br />
0<br />
0<br />
0<br />
0<br />
0<br />
0<br />
0<br />
0<br />
0 0<br />
0<br />
Operation and Maintenance Expenses 1301 1405 1362 1449 1490 1522 1555 1587 1620 1652 1685 1716 1748<br />
1778<br />
1808 1837 1866 1894 1922 1949 1976 2003 2029 2056 2082<br />
Operation Expenses 65 117 72<br />
127<br />
79<br />
80<br />
82<br />
84<br />
86<br />
87<br />
89<br />
91<br />
92<br />
94<br />
96<br />
97<br />
99<br />
100<br />
102<br />
103<br />
104<br />
106<br />
107 109<br />
110<br />
Maintenance Expenses 1196 1247 1248<br />
1278<br />
1365<br />
1395<br />
1425<br />
1455<br />
1484<br />
1513<br />
1543<br />
1572<br />
1602<br />
1629<br />
1656<br />
1683<br />
1709<br />
1735<br />
1760<br />
1785<br />
1810<br />
1834<br />
1858 1882<br />
1906<br />
Energy Costs 40 41 42<br />
43<br />
46<br />
47<br />
48<br />
49<br />
50<br />
51<br />
52<br />
53<br />
54<br />
55<br />
56<br />
57<br />
58<br />
59<br />
60<br />
61<br />
62<br />
63<br />
64 65<br />
66<br />
Chemical Costs 0 0 0<br />
0<br />
0<br />
0<br />
0<br />
0<br />
0<br />
0<br />
0<br />
0<br />
0<br />
0<br />
0<br />
0<br />
0<br />
0<br />
0<br />
0<br />
0<br />
0<br />
0 0<br />
0<br />
Depreciation 745 788 946 976 1064 1064 1085 1082 1082 1082 1083 1088 1138<br />
1188<br />
1222 1254 1254 1254 1254 1297 1298 1299 1298 1299 1299<br />
System Assets 745 788 946<br />
976<br />
1064<br />
1064<br />
1085<br />
1082<br />
1082<br />
1082<br />
1083<br />
1088<br />
1138<br />
1188<br />
1222<br />
1254<br />
1254<br />
1254<br />
1254<br />
1297<br />
1298<br />
1299<br />
1298 1299<br />
1299<br />
Plant & Equipment 0 0 0<br />
0<br />
0<br />
0<br />
0<br />
0<br />
0<br />
0<br />
0<br />
0<br />
0<br />
0<br />
0<br />
0<br />
0<br />
0<br />
0<br />
0<br />
0<br />
0<br />
0 0<br />
0<br />
Interest Expenses 57 67 356<br />
431<br />
792<br />
744<br />
761<br />
711<br />
664<br />
616<br />
566<br />
517<br />
605<br />
715<br />
784<br />
854<br />
783<br />
711<br />
640<br />
762<br />
681<br />
600<br />
524 460<br />
402<br />
Other Expenses 0 0 0<br />
0<br />
0<br />
0<br />
0<br />
0<br />
0<br />
0<br />
0<br />
0<br />
0<br />
0<br />
0<br />
0<br />
0<br />
0<br />
0<br />
0<br />
0<br />
0<br />
0 0<br />
0<br />
TOTAL EXPENSES 2829 3069 3445 3524 4060 4084 4148 4142 4143 4142 4170 4143 4330 4534 4681 4856 4797 4768 4738 4944 4936 4863 4824 4800 4782<br />
REVENUES<br />
Rates & Service Availability Charges 2734 2775 3003 3076 3288 3368 3443 3522 3597 3667 3747 3817 3896<br />
3967<br />
4033 4100 4167 4236 4300 4364 4429 4493 4554 4613 4675<br />
Residential 2480 2515 2718<br />
2785<br />
2991<br />
3063<br />
3131<br />
3204<br />
3272<br />
3337<br />
3409<br />
3473<br />
3545<br />
3613<br />
3676<br />
3741<br />
3806<br />
3872<br />
3933<br />
3994<br />
4056<br />
4118<br />
4176 4233<br />
4292<br />
Non-Residential 254 260 285<br />
291<br />
298<br />
305<br />
312<br />
318<br />
324<br />
330<br />
338<br />
344<br />
351<br />
353<br />
356<br />
359<br />
361<br />
365<br />
367<br />
370<br />
373<br />
375<br />
378 381<br />
383<br />
Trade Waste Charges 61 61 67<br />
69<br />
73<br />
75<br />
77<br />
79<br />
81<br />
82<br />
83<br />
85<br />
87<br />
89<br />
90<br />
92<br />
93<br />
95<br />
96<br />
98<br />
99<br />
101<br />
102 104<br />
105<br />
Other Sales and Charges 0 0 0<br />
0<br />
0<br />
0<br />
0<br />
0<br />
0<br />
0<br />
0<br />
0<br />
0<br />
0<br />
0<br />
0<br />
0<br />
0<br />
0<br />
0<br />
0<br />
0<br />
0 0<br />
0<br />
Extra Charges 0 0 0<br />
0<br />
0<br />
0<br />
0<br />
0<br />
0<br />
0<br />
0<br />
0<br />
0<br />
0<br />
0<br />
0<br />
0<br />
0<br />
0<br />
0<br />
0<br />
0<br />
0 0<br />
0<br />
Interest Income 332 299 166<br />
89<br />
88<br />
91<br />
85<br />
89<br />
103<br />
116<br />
126<br />
131<br />
99<br />
62<br />
46<br />
37<br />
36<br />
36<br />
40<br />
38<br />
34<br />
34<br />
43 57<br />
80<br />
Other Revenues 0 0 0<br />
0<br />
0<br />
0<br />
0<br />
0<br />
0<br />
0<br />
0<br />
0<br />
0<br />
0<br />
0<br />
0<br />
0<br />
0<br />
0<br />
0<br />
0<br />
0<br />
0 0<br />
0<br />
Grants 151 812 2810 60 62 62 62 61 60 60 60 59 58<br />
57<br />
57 56 55 54 53 53 52 52 51 50 49<br />
Grants for Acquisition of Assets 88 750 2750<br />
0<br />
0<br />
0<br />
0<br />
0<br />
0<br />
0<br />
0<br />
0<br />
0<br />
0<br />
0<br />
0<br />
0<br />
0<br />
0<br />
0<br />
0<br />
0<br />
0 0<br />
0<br />
Pensioner Rebate Subsidy 63 61 60<br />
60<br />
62<br />
62<br />
62<br />
61<br />
60<br />
60<br />
60<br />
59<br />
58<br />
57<br />
57<br />
56<br />
55<br />
54<br />
53<br />
53<br />
52<br />
52<br />
51 50<br />
49<br />
Other Grants 0 0 0<br />
0<br />
0<br />
0<br />
0<br />
0<br />
0<br />
0<br />
0<br />
0<br />
0<br />
0<br />
0<br />
0<br />
0<br />
0<br />
0<br />
0<br />
0<br />
0<br />
0 0<br />
0<br />
Contributions 204 204 418 418 418 410 410 410 410 410 376 370 365<br />
360<br />
355 349 344 339 333 328 328 328 328 328 328<br />
Developer Charges 204 204 418<br />
418<br />
418<br />
410<br />
410<br />
410<br />
410<br />
410<br />
376<br />
370<br />
365<br />
360<br />
355<br />
349<br />
344<br />
339<br />
333<br />
328<br />
328<br />
328<br />
328 328<br />
328<br />
Developer Provided Assets 0 0 0<br />
0<br />
0<br />
0<br />
0<br />
0<br />
0<br />
0<br />
0<br />
0<br />
0<br />
0<br />
0<br />
0<br />
0<br />
0<br />
0<br />
0<br />
0<br />
0<br />
0 0<br />
0<br />
Other Contributions 0 0 0<br />
0<br />
0<br />
0<br />
0<br />
0<br />
0<br />
0<br />
0<br />
0<br />
0<br />
0<br />
0<br />
0<br />
0<br />
0<br />
0<br />
0<br />
0<br />
0<br />
0 0<br />
0<br />
TOTAL REVENUES 3482 4150 6463 3712 3929 4006 4077 4161 4250 4335 4392 4462 4505 4534 4580 4634 4696 4761 4823 4881 4942 5007 5077 5152 5238<br />
OPERATING RESULT 653 1082 3018 188 -131 -78 -71 20 107 193 222 319 175 0 -100 -223 -102 -7 85 -63 6 144 253 352 456<br />
OPERATING RESULT (less Grants for Acq of<br />
Assets)<br />
565 331 269 188 -131 -78 -71 20 107 193 222 319 175 0 -100 -223 -102 -7 85 -63 6 144 253 352 456<br />
Printed 5/03/2008 Values in 2006/07 $'000<br />
Page 1
MWRC Sewer Fund Financial Model - 2006-07 : Preferred Case<br />
Cashflow Statement<br />
FINMOD<br />
DEPARTMENT OF<br />
COMMERCE<br />
2006/07 2007/08 2008/09 2009/10 2010/11 2011/12 2012/13 2013/14 2014/15 2015/16 2016/17 2017/18 2018/19 2019/20 2020/21 2021/22 2022/23 2023/24 2024/25 2025/26 2026/27 2027/28 2028/29 2029/30 2030/31<br />
Cashflow From Operating Activities<br />
Receipts<br />
Rates and Charges 2795 2836 3070<br />
3144<br />
3361<br />
3443<br />
3520<br />
3601<br />
3677<br />
3749<br />
3831<br />
3903<br />
3983<br />
4055<br />
4123<br />
4191<br />
4261<br />
4331<br />
4396<br />
4462<br />
4528<br />
4594<br />
4656 4717<br />
4780<br />
Interest Income 332 299 166<br />
89<br />
88<br />
91<br />
85<br />
89<br />
103<br />
116<br />
126<br />
131<br />
99<br />
62<br />
46<br />
37<br />
36<br />
36<br />
40<br />
38<br />
34<br />
34<br />
43 57<br />
80<br />
Other Revenues 0 0 0<br />
0<br />
0<br />
0<br />
0<br />
0<br />
0<br />
0<br />
0<br />
0<br />
0<br />
0<br />
0<br />
0<br />
0<br />
0<br />
0<br />
0<br />
0<br />
0<br />
0 0<br />
0<br />
Grants 151 812 2810<br />
60<br />
62<br />
62<br />
62<br />
61<br />
60<br />
60<br />
60<br />
59<br />
58<br />
57<br />
57<br />
56<br />
55<br />
54<br />
53<br />
53<br />
52<br />
52<br />
51 50<br />
49<br />
Contributions 204 204 418<br />
418<br />
418<br />
410<br />
410<br />
410<br />
410<br />
410<br />
376<br />
370<br />
365<br />
360<br />
355<br />
349<br />
344<br />
339<br />
333<br />
328<br />
328<br />
328<br />
328 328<br />
328<br />
Total Receipts from Operations 3482 4150 6463 3712 3929 4006 4077 4161 4250 4335 4392 4462 4505 4534 4580 4634 4696 4761 4823 4881 4942 5007 5077 5152 5238<br />
Payments<br />
Management 726 809 780<br />
669<br />
715<br />
756<br />
746<br />
762<br />
777<br />
792<br />
836<br />
823<br />
839<br />
853<br />
867<br />
912<br />
895<br />
908<br />
922<br />
935<br />
981<br />
961<br />
973 986<br />
998<br />
Operations (plus WC Inc) 1300 1404 1361<br />
1447<br />
1487<br />
1521<br />
1554<br />
1586<br />
1619<br />
1650<br />
1683<br />
1714<br />
1746<br />
1777<br />
1807<br />
1836<br />
1865<br />
1894<br />
1921<br />
1949<br />
1974<br />
2001<br />
2028 2054<br />
2081<br />
Interest Expenses 57 67 356<br />
431<br />
792<br />
744<br />
761<br />
711<br />
664<br />
616<br />
566<br />
517<br />
605<br />
715<br />
784<br />
854<br />
783<br />
711<br />
640<br />
762<br />
681<br />
600<br />
524 460<br />
402<br />
Other Expenses 0 0 0<br />
0<br />
0<br />
0<br />
0<br />
0<br />
0<br />
0<br />
0<br />
0<br />
0<br />
0<br />
0<br />
0<br />
0<br />
0<br />
0<br />
0<br />
0<br />
0<br />
0 0<br />
0<br />
Total Payments from Operations 2083 2280 2498 2547 2994 3020 3061 3058 3060 3058 3086 3054 3191 3345 3458 3601 3543 3513 3483 3646 3637 3563 3525 3500 3481<br />
Net Cash from Operations 1399 1871 3966 1165 935 986 1016 1103 1190 1277 1307 1408 1314 1190 1122 1032 1153 1248 1340 1234 1306 1444 1553 1652 1756<br />
Cashflow from Capital Activities<br />
Receipts<br />
Proceeds from Disposal of Assets 0 0 0<br />
0<br />
0<br />
0<br />
0<br />
0<br />
0<br />
0<br />
0<br />
0<br />
0<br />
0<br />
0<br />
0<br />
0<br />
0<br />
0<br />
0<br />
0<br />
0<br />
0 0<br />
0<br />
Payments<br />
Acquisition of Assets 814 3388 11330<br />
2332<br />
6484<br />
335<br />
1845<br />
145<br />
345<br />
345<br />
395<br />
695<br />
3845<br />
3845<br />
2645<br />
2546<br />
345<br />
345<br />
345<br />
3345<br />
395<br />
395<br />
345 345<br />
345<br />
Net Cash from Capital Activities -814 -3388 -11330 -2332 -6484 -335 -1845 -145 -345 -345 -395 -695 -3845 -3845 -2645 -2546 -345 -345 -345 -3345 -395 -395 -345 -345 -345<br />
CashFlow from Financing Activities<br />
Receipts<br />
New Loans Required 17 150 4550<br />
1500<br />
6000<br />
0<br />
1000<br />
0<br />
0<br />
0<br />
0<br />
0<br />
2100<br />
2500<br />
2000<br />
2101<br />
0<br />
0<br />
0<br />
<strong>3000</strong><br />
0<br />
0<br />
0 0<br />
0<br />
Payments<br />
Principal Loan Payments 53 53 170<br />
215<br />
376<br />
388<br />
428<br />
442<br />
459<br />
474<br />
490<br />
509<br />
581<br />
587<br />
662<br />
737<br />
763<br />
790<br />
818<br />
923<br />
954<br />
979<br />
782 735<br />
457<br />
Net Cash from Financing Activities -36 96 4380 1285 5624 -388 572 -442 -459 -474 -490 -509 1519 1913 1338 1363 -763 -790 -818 2078 -954 -979 -782 -735 -457<br />
TOTAL NET CASH 549 -1421 -2984 118 75 263 -257 516 387 458 421 204 -1011 -742 -185 -150 45 113 177 -34 -43 70 425 572 955<br />
Current Year Cash 549 -1421 -2984<br />
118<br />
75<br />
263<br />
-257<br />
516<br />
387<br />
458<br />
421<br />
204<br />
-1011<br />
-742<br />
-185<br />
-150<br />
45<br />
113<br />
177<br />
-34<br />
-43<br />
70<br />
425 572<br />
955<br />
Cash & Investments @Year Start 5934 6294 4731<br />
1696<br />
1761<br />
1782<br />
1986<br />
1678<br />
2131<br />
2444<br />
2818<br />
3145<br />
3252<br />
2175<br />
1391<br />
1171<br />
991<br />
1006<br />
1086<br />
1227<br />
1158<br />
1083<br />
1119 1499<br />
2011<br />
Cash & Investments @Year End 6483 4873 1747 1814 1836 2045 1729 2195 2517 2902 3239 3349 2240 1433 1206 1021 1036 1119 1263 1193 1115 1153 1544 2071 2966<br />
Capital Works Funding:<br />
Internal Funding for New Works ($'000) 310 2166 3706<br />
506<br />
156<br />
0<br />
510<br />
-190<br />
10<br />
10<br />
60<br />
360<br />
1410<br />
1010<br />
310<br />
110<br />
10<br />
10<br />
10<br />
10<br />
60<br />
60<br />
10 10<br />
10<br />
Internal Funding for Renewals 399 322 324<br />
326<br />
328<br />
335<br />
335<br />
335<br />
335<br />
335<br />
335<br />
335<br />
335<br />
335<br />
335<br />
335<br />
335<br />
335<br />
335<br />
335<br />
335<br />
335<br />
335 335<br />
335<br />
New Loans 17 150 4550<br />
1500<br />
6000<br />
0<br />
1000<br />
0<br />
0<br />
0<br />
0<br />
0<br />
2100<br />
2500<br />
2000<br />
2101<br />
0<br />
0<br />
0<br />
<strong>3000</strong><br />
0<br />
0<br />
0 0<br />
0<br />
Grants 88 750 2750<br />
0<br />
0<br />
0<br />
0<br />
0<br />
0<br />
0<br />
0<br />
0<br />
0<br />
0<br />
0<br />
0<br />
0<br />
0<br />
0<br />
0<br />
0<br />
0<br />
0 0<br />
0<br />
Total Capital Works 814 3388 11330 2332 6484 335 1845 145 345 345 395 695 3845 3845 2645 2546 345 345 345 3345 395 395 345 345 345<br />
Printed 5/03/2008 Values in 2006/07 $'000<br />
Page 2
MWRC Sewer Fund Financial Model - 2006-07 : Preferred Case<br />
Statement of Financial Position<br />
FINMOD<br />
DEPARTMENT OF<br />
COMMERCE<br />
2006/07 2007/08 2008/09 2009/10 2010/11 2011/12 2012/13 2013/14 2014/15 2015/16 2016/17 2017/18 2018/19 2019/20 2020/21 2021/22 2022/23 2023/24 2024/25 2025/26 2026/27 2027/28 2028/29 2029/30 2030/31<br />
Cash and Investments 6483 4873 1747<br />
1814<br />
1836<br />
2045<br />
1729<br />
2195<br />
2517<br />
2902<br />
3239<br />
3349<br />
2240<br />
1433<br />
1206<br />
1021<br />
1036<br />
1119<br />
1263<br />
1193<br />
1115<br />
1153<br />
1544 2071<br />
2966<br />
Receivables 87 88 90<br />
92<br />
98<br />
100<br />
102<br />
104<br />
107<br />
109<br />
111<br />
113<br />
115<br />
117<br />
119<br />
121<br />
123<br />
125<br />
126<br />
128<br />
130<br />
132<br />
134 135<br />
137<br />
Inventories 18 18 19<br />
19<br />
20<br />
21<br />
21<br />
21<br />
21<br />
21<br />
22<br />
22<br />
22<br />
22<br />
22<br />
23<br />
24<br />
24<br />
25<br />
25<br />
25<br />
26<br />
26 26<br />
27<br />
Property, Plant & Equipment 18949 21549 31932 33288 38710 37981 38740 37803 37065 36328 35641 35248 37955<br />
40612<br />
42035 43328 42419 41510 40601 42649 41747 40843 39889 38936 37982<br />
System Assets (1) 18949 21549 31932<br />
33288<br />
38710<br />
37981<br />
38740<br />
37803<br />
37065<br />
36328<br />
35641<br />
35248<br />
37955<br />
40612<br />
42035<br />
43328<br />
42419<br />
41510<br />
40601<br />
42649<br />
41747<br />
40843<br />
39889 38936<br />
37982<br />
Plant & Equipment 0 0 0<br />
0<br />
0<br />
0<br />
0<br />
0<br />
0<br />
0<br />
0<br />
0<br />
0<br />
0<br />
0<br />
0<br />
0<br />
0<br />
0<br />
0<br />
0<br />
0<br />
0 0<br />
0<br />
Other Assets 0 0 0<br />
0<br />
0<br />
0<br />
0<br />
0<br />
0<br />
0<br />
0<br />
0<br />
0<br />
0<br />
0<br />
0<br />
0<br />
0<br />
0<br />
0<br />
0<br />
0<br />
0 0<br />
0<br />
TOTAL ASSETS 25537 26528 33787 35213 40663 40147 40592 40123 39710 39361 39012 38731 40332 42184 43383 44492 43601 42778 42015 43996 43017 42153 41593 41169 41112<br />
LIABILITIES<br />
Bank Overdraft 0 0 0<br />
0<br />
0<br />
0<br />
0<br />
0<br />
0<br />
0<br />
0<br />
0<br />
0<br />
0<br />
0<br />
0<br />
0<br />
0<br />
0<br />
0<br />
0<br />
0<br />
0 0<br />
0<br />
Creditors 14 15 15<br />
16<br />
17<br />
17<br />
18<br />
18<br />
18<br />
18<br />
19<br />
19<br />
19<br />
19<br />
19<br />
19<br />
19<br />
19<br />
19<br />
19<br />
20<br />
20<br />
21 21<br />
22<br />
Borrowings 909 979 5330<br />
6460<br />
11896<br />
11161<br />
11408<br />
10634<br />
9865<br />
9104<br />
8349<br />
7597<br />
8895<br />
10549<br />
11580<br />
12606<br />
11476<br />
10352<br />
9233<br />
11042<br />
9766<br />
8502<br />
7472 6520<br />
5874<br />
Provisions 110 112 113<br />
116<br />
124<br />
127<br />
130<br />
133<br />
135<br />
138<br />
141<br />
143<br />
146<br />
148<br />
151<br />
153<br />
156<br />
158<br />
160<br />
163<br />
165<br />
167<br />
169 171<br />
174<br />
TOTAL LIABILITIES 1033 1105 5459 6592 12037 11305 11556 10784 10018 9261 8508 7759 9060 10717 11750 12779 11651 10530 9413 11224 9951 8690 7662 6713 6069<br />
NET ASSETS COMMITTED 24504 25423 28329 28621 28626 28841 29036 29339 29692 30100 30504 30972 31272 31467 31633 31713 31950 32248 32602 32772 33066 33463 33931 34456 35043<br />
EQUITY<br />
Accumulated Operating Result 23954 24338 26647<br />
26059<br />
25168<br />
24357<br />
23576<br />
22909<br />
22349<br />
21891<br />
21476<br />
21169<br />
20728<br />
20124<br />
19438<br />
18649<br />
18004<br />
17473<br />
17049<br />
16489<br />
16015<br />
15692<br />
15488 15389<br />
15397<br />
Asset Revaluation Reserve 550 1085 1682<br />
2562<br />
3458<br />
4485<br />
5460<br />
6430<br />
7343<br />
8209<br />
9028<br />
9803<br />
10545<br />
11343<br />
12195<br />
13064<br />
13946<br />
14775<br />
15554<br />
16283<br />
17052<br />
17771<br />
18443 19067<br />
19646<br />
TOTAL EQUITY 24504 25423 28329 28621 28626 28841 29036 29339 29692 30100 30504 30972 31272 31467 31633 31713 31950 32248 32602 32772 33066 33463 33931 34456 35043<br />
(1) Notes to System Assets<br />
Current Replacement Cost 41775 44841 55847<br />
57853<br />
64009<br />
64009<br />
65519<br />
65329<br />
65339<br />
65349<br />
65409<br />
65769<br />
69278<br />
72788<br />
75098<br />
77309<br />
77319<br />
77329<br />
77339<br />
80349<br />
80409<br />
80470<br />
80479 80490<br />
80500<br />
Less: Accumulated Depreciation 22826 23292 23915<br />
24564<br />
25300<br />
26028<br />
26779<br />
27526<br />
28273<br />
29020<br />
29768<br />
30521<br />
31323<br />
32176<br />
33063<br />
33981<br />
34900<br />
35819<br />
36738<br />
37700<br />
38663<br />
39627<br />
40590 41554<br />
42517<br />
Written Down Current Cost 18949 21549 31932<br />
33288<br />
38710<br />
37981<br />
38740<br />
37803<br />
37065<br />
36328<br />
35641<br />
35248<br />
37955<br />
40612<br />
42035<br />
43328<br />
42419<br />
41510<br />
40601<br />
42649<br />
41747<br />
40843<br />
39889 38936<br />
37982<br />
Printed 5/03/2008 Values in 2006/07 $'000<br />
Page 3
MWRC Sewer Fund Financial Model - 2006-07 : Preferred Case<br />
Performance Indicators<br />
FINMOD<br />
DEPARTMENT OF<br />
COMMERCE<br />
2006/07 2007/08 2008/09 2009/10 2010/11 2011/12 2012/13 2013/14 2014/15 2015/16 2016/17 2017/18 2018/19 2019/20 2020/21 2021/22 2022/23 2023/24 2024/25 2025/26 2026/27 2027/28 2028/29 2029/30 2030/31<br />
Typical Residential Bills 460 460 490<br />
490<br />
490<br />
490<br />
490<br />
490<br />
490<br />
490<br />
490<br />
490<br />
490<br />
490<br />
490<br />
490<br />
490<br />
490<br />
490<br />
490<br />
490<br />
490<br />
490 490<br />
490<br />
Average Residential Bills (2006/07$) 440 441 471<br />
471<br />
472<br />
473<br />
473<br />
474<br />
474<br />
474<br />
475<br />
475<br />
476<br />
477<br />
477<br />
477<br />
477<br />
478<br />
478<br />
478<br />
479<br />
479<br />
480 480<br />
480<br />
Mgmnt Cost / Assessment (2006/07$) 117 129 123<br />
102<br />
103<br />
106<br />
103<br />
102<br />
103<br />
103<br />
106<br />
103<br />
102<br />
103<br />
102<br />
107<br />
103<br />
103<br />
103<br />
103<br />
106<br />
103<br />
103 103<br />
103<br />
OMA Cost per Assessment (2006/07$) 327 352 337<br />
325<br />
317<br />
320<br />
317<br />
316<br />
317<br />
317<br />
320<br />
316<br />
316<br />
317<br />
317<br />
320<br />
317<br />
316<br />
317<br />
317<br />
320<br />
317<br />
317 317<br />
317<br />
Operating Sales Margin (%) 9.47 3.19 12.94<br />
14.62<br />
14.90<br />
14.65<br />
15.17<br />
15.73<br />
16.11<br />
16.44<br />
15.52<br />
16.26<br />
15.47<br />
14.60<br />
14.07<br />
12.92<br />
13.85<br />
14.14<br />
14.31<br />
13.66<br />
13.30<br />
14.29<br />
14.58 14.81<br />
15.09<br />
Economic Real Rate of Return (%) 1.53 0.46 1.44<br />
1.59<br />
1.48<br />
1.51<br />
1.56<br />
1.69<br />
1.80<br />
1.91<br />
1.86<br />
2.00<br />
1.80<br />
1.61<br />
1.52<br />
1.37<br />
1.52<br />
1.61<br />
1.69<br />
1.55<br />
1.56<br />
1.74<br />
1.84 1.94<br />
2.05<br />
Debt Service Ratio 0.03 0.04 0.14<br />
0.17<br />
0.30<br />
0.28<br />
0.29<br />
0.28<br />
0.26<br />
0.25<br />
0.24<br />
0.23<br />
0.26<br />
0.29<br />
0.32<br />
0.34<br />
0.33<br />
0.32<br />
0.30<br />
0.35<br />
0.33<br />
0.32<br />
0.26 0.23<br />
0.16<br />
Debt/Equity Ratio 0.04 0.04 0.19<br />
0.23<br />
0.42<br />
0.39<br />
0.39<br />
0.36<br />
0.33<br />
0.30<br />
0.27<br />
0.25<br />
0.28<br />
0.34<br />
0.37<br />
0.40<br />
0.36<br />
0.32<br />
0.28<br />
0.34<br />
0.30<br />
0.25<br />
0.22 0.19<br />
0.17<br />
Interest Cover 10.91 5.94 1.75<br />
1.44<br />
0.83<br />
0.89<br />
0.91<br />
1.03<br />
1.16<br />
1.31<br />
1.39<br />
1.62<br />
1.29<br />
1.00<br />
0.87<br />
0.74<br />
0.87<br />
0.99<br />
1.13<br />
0.92<br />
1.01<br />
1.24<br />
1.48 1.76<br />
2.13<br />
Return on capital (%) 2.44 1.58 2.32<br />
1.76<br />
1.62<br />
1.66<br />
1.70<br />
1.82<br />
1.94<br />
2.06<br />
2.02<br />
2.16<br />
1.94<br />
1.69<br />
1.58<br />
1.42<br />
1.56<br />
1.65<br />
1.72<br />
1.59<br />
1.60<br />
1.77<br />
1.87 1.97<br />
2.09<br />
Cash and Investments (2006/07$'000) 6483 4873 1747<br />
1814<br />
1836<br />
2045<br />
1729<br />
2195<br />
2517<br />
2902<br />
3239<br />
3349<br />
2240<br />
1433<br />
1206<br />
1021<br />
1036<br />
1119<br />
1263<br />
1193<br />
1115<br />
1153<br />
1544 2071<br />
2966<br />
Debt outstanding (2006/07$'000) 909 979 5330<br />
6460<br />
11896<br />
11161<br />
11408<br />
10634<br />
9865<br />
9104<br />
8349<br />
7597<br />
8895<br />
10549<br />
11580<br />
12606<br />
11476<br />
10352<br />
9233<br />
11042<br />
9766<br />
8502<br />
7472 6520<br />
5874<br />
Net Debt (2006/07$'000) 0 0 3583<br />
4646<br />
10060<br />
9116<br />
9679<br />
8439<br />
7348<br />
6202<br />
5110<br />
4248<br />
6655<br />
9116<br />
10374<br />
11585<br />
10440<br />
9233<br />
7970<br />
9849<br />
8651<br />
7349<br />
5928 4449<br />
2908<br />
Printed 5/03/2008 Page 4
MWRC Sewer Fund Financial Model - 2006-07 : Preferred Case<br />
STANDARD LOAN PAYMENT SCHEDULE<br />
FINMOD<br />
DEPARTMENT OF<br />
COMMERCE<br />
Drawdown<br />
2006/07 2007/08 2008/09 2009/10 2010/11 2011/12 2012/13 2013/14 2014/15 2015/16 2016/17 2017/18 2018/19 2019/20 2020/21 2021/22 2022/23 2023/24 2024/25 2025/26 2026/27 2027/28 2028/29 2029/30 2030/31<br />
2006/07 Principal 17 0 0 0<br />
0<br />
0<br />
0<br />
0<br />
0<br />
0<br />
0<br />
0<br />
0<br />
0<br />
1<br />
2<br />
2<br />
2<br />
2<br />
2<br />
2<br />
0<br />
0<br />
0 0<br />
0<br />
Interest 2 2 2<br />
1<br />
0<br />
0<br />
0<br />
0<br />
0<br />
0<br />
0<br />
0<br />
0<br />
0<br />
0<br />
0<br />
0<br />
0<br />
0<br />
0<br />
0<br />
0<br />
0 0<br />
0<br />
2007/08 Principal 154 4 4<br />
4<br />
4<br />
5<br />
6<br />
6<br />
6<br />
6<br />
7<br />
8<br />
8<br />
8<br />
9<br />
10<br />
10<br />
11<br />
12<br />
12<br />
14<br />
0<br />
0 0<br />
0<br />
Interest 10 10<br />
10<br />
10<br />
8<br />
8<br />
8<br />
8<br />
8<br />
7<br />
6<br />
6<br />
6<br />
5<br />
4<br />
4<br />
3<br />
2<br />
2<br />
0<br />
0<br />
0 0<br />
0<br />
2008/09 Principal 4827 122 131<br />
140<br />
149<br />
159<br />
169<br />
181<br />
193<br />
205<br />
219<br />
233<br />
248<br />
265<br />
282<br />
301<br />
321<br />
342<br />
364<br />
388<br />
415<br />
0 0<br />
0<br />
Interest 312 304<br />
295<br />
286<br />
276<br />
265<br />
255<br />
243<br />
229<br />
216<br />
202<br />
186<br />
170<br />
152<br />
133<br />
113<br />
93<br />
70<br />
46<br />
20<br />
0 0<br />
0<br />
2009/10 Principal 1639 42 45<br />
47<br />
51<br />
54<br />
57<br />
61<br />
65<br />
69<br />
75<br />
79<br />
84<br />
90<br />
96<br />
102<br />
109<br />
116<br />
124<br />
132<br />
140 0<br />
0<br />
Interest 106 103<br />
100<br />
97<br />
93<br />
91<br />
87<br />
83<br />
78<br />
73<br />
69<br />
63<br />
58<br />
52<br />
46<br />
38<br />
32<br />
24<br />
16<br />
7 0<br />
0<br />
2010/11 Principal 6753 172 183<br />
195<br />
208<br />
222<br />
236<br />
252<br />
269<br />
287<br />
305<br />
326<br />
348<br />
370<br />
395<br />
421<br />
449<br />
478<br />
510<br />
544 580<br />
0<br />
Interest 436 425<br />
413<br />
400<br />
386<br />
372<br />
356<br />
339<br />
321<br />
303<br />
282<br />
261<br />
238<br />
213<br />
187<br />
159<br />
130<br />
98<br />
65 29<br />
0<br />
2012/13 Principal 1194 30 32<br />
35<br />
37<br />
39<br />
42<br />
45<br />
47<br />
51<br />
54<br />
57<br />
61<br />
65<br />
69<br />
75<br />
79<br />
85 90<br />
96<br />
Interest 77 75<br />
73<br />
71<br />
68<br />
65<br />
63<br />
60<br />
57<br />
53<br />
49<br />
47<br />
42<br />
37<br />
33<br />
28<br />
23 17<br />
11<br />
2018/19 Principal 2994 77<br />
81<br />
87<br />
92<br />
98<br />
105<br />
112<br />
120<br />
128<br />
136<br />
144 154<br />
164<br />
Interest 193<br />
189<br />
183<br />
177<br />
171<br />
164<br />
158<br />
150<br />
142<br />
134<br />
125 116<br />
105<br />
2019/20 Principal 3672 93<br />
100<br />
106<br />
114<br />
120<br />
128<br />
138<br />
146<br />
156<br />
166 177<br />
189<br />
Interest 237<br />
231<br />
224<br />
218<br />
210<br />
202<br />
194<br />
184<br />
175<br />
165 153<br />
141<br />
2020/21 Principal 3025 77<br />
82<br />
87<br />
93<br />
100<br />
106<br />
113<br />
120<br />
128 137<br />
146<br />
Interest 195<br />
190<br />
185<br />
179<br />
173<br />
166<br />
160<br />
152<br />
144 136<br />
126<br />
2021/22 Principal 3273 83<br />
89<br />
95<br />
101<br />
108<br />
114<br />
122<br />
130 139<br />
148<br />
Interest 211<br />
206<br />
200<br />
194<br />
187<br />
180<br />
172<br />
164 156<br />
146<br />
2025/26 Principal 5261 134<br />
143<br />
152<br />
162 173<br />
185<br />
Interest 340<br />
331<br />
322<br />
311 301<br />
289<br />
Total Principal 32809 0 4 126<br />
177<br />
361<br />
384<br />
441<br />
469<br />
501<br />
533<br />
568<br />
607<br />
725<br />
862<br />
1001<br />
1149<br />
1224<br />
1305<br />
1392<br />
1618<br />
1723<br />
1822<br />
1499 1450<br />
928<br />
Total Interest 2 12 324<br />
421<br />
844<br />
819<br />
871<br />
841<br />
813<br />
781<br />
743<br />
704<br />
858<br />
1050<br />
1186<br />
1330<br />
1256<br />
1175<br />
1089<br />
1337<br />
1230<br />
1117<br />
1004 908<br />
818<br />
Printed 5/03/2008 Values in 2006/07 $'000<br />
Page 1
MWRC Sewer Fund Financial Model - 2006-07 : Preferred Case<br />
Summary Report of Assumptions and Results<br />
FINMOD<br />
DEPARTMENT OF<br />
COMMERCE<br />
2006/07 2010/11 2015/16 2020/21 2025/26 2030/31 2035/36<br />
Inflation Rates - General (%) 3.00 3.00<br />
3.00<br />
3.00<br />
3.00<br />
3.00<br />
3.00<br />
Inflation Rates - Capital Works (%) 3.00 3.00<br />
3.00<br />
3.00<br />
3.00<br />
3.00<br />
3.00<br />
Borrowing Interest Rate (%) 6.50 6.50<br />
6.50<br />
6.50<br />
6.50<br />
6.50<br />
6.50<br />
Term of New Loans (years) 20 20<br />
20<br />
20<br />
20<br />
20<br />
20<br />
Investment Interest Rate (%) 5.50 5.50<br />
5.50<br />
5.50<br />
5.50<br />
5.50<br />
5.50<br />
Growth Rate - Residential (%) 1.18 7.29<br />
1.99<br />
1.75<br />
1.50<br />
1.33<br />
1.24<br />
Developer Charges per Assessment -<br />
Residential (2006/07 $)<br />
1300 2649<br />
2649<br />
2649<br />
2649<br />
2649<br />
2649<br />
Subsidised Scheme Capital Works ($m) 0.35 6.00<br />
0.00<br />
2.30<br />
3.00<br />
0.00<br />
0.00<br />
Grants on Acquisition of Assets ($m) 0.09 0.00<br />
0.00<br />
0.00<br />
0.00<br />
0.00<br />
0.00<br />
Renewals ($m) 0.40 0.33<br />
0.34<br />
0.34<br />
0.34<br />
0.34<br />
0.34<br />
Renewals (%) 0.96 0.51<br />
0.51<br />
0.45<br />
0.42<br />
0.42<br />
0.42<br />
Borrowing Outstanding ($m) 0.91 11.90<br />
9.10<br />
11.58<br />
11.04<br />
5.87<br />
2.88<br />
Mgmnt Cost / Assessment 117 103<br />
103<br />
102<br />
103<br />
103<br />
103<br />
Debt Equity Ratio 0.04 0.37<br />
0.23<br />
0.24<br />
0.19<br />
0.08<br />
0.03<br />
OMA Cost Per Assessment 327 317<br />
317<br />
317<br />
317<br />
317<br />
317<br />
Economic Real Rate of Return (%) 1.53 1.48<br />
1.91<br />
1.52<br />
1.55<br />
2.05<br />
2.70<br />
Return on Capital (%) 2.44 1.62<br />
2.06<br />
1.58<br />
1.59<br />
2.09<br />
2.63<br />
Net Debt ($m) 0.00 10.06<br />
6.20<br />
10.37<br />
9.85<br />
2.91<br />
0.00<br />
Debt Service Ratio 0.03 0.30<br />
0.25<br />
0.32<br />
0.35<br />
0.16<br />
0.12<br />
Average Residential Bills 440 472<br />
474<br />
477<br />
478<br />
480<br />
482<br />
Typical Residential Bills 460 490<br />
490<br />
490<br />
490<br />
490<br />
490<br />
Printed 5/03/2008 Values in 2006/07 $<br />
Page 1
Appendices<br />
<strong>Mid</strong>-<strong>Western</strong> <strong>Regional</strong> <strong>Council</strong><br />
Strategic Business Plan for Sewerage