
You also want an ePaper? Increase the reach of your titles
YUMPU automatically turns print PDFs into web optimized ePapers that Google loves.
16<br />
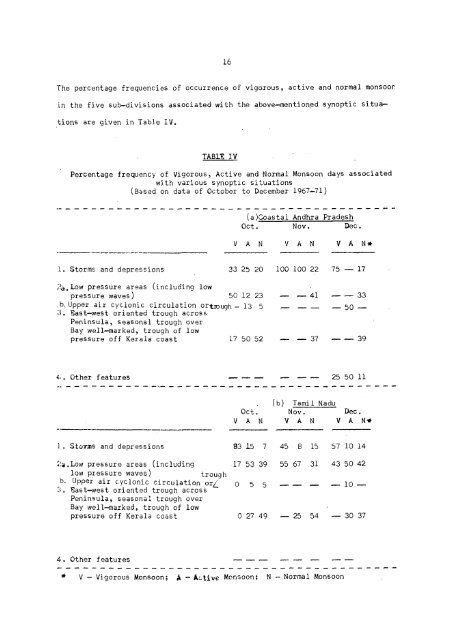
The percentage frequencies of occurrence of vigorous, active and normal monsoor<br />
in the five sub—divisions associated with the above-mentioned synoptic situations<br />
are given in Table <strong>IV</strong>.<br />
TABLE <strong>IV</strong><br />
Percentage frequency of Vigorous, Active and <strong>No</strong>rmal Monsoon days associated<br />
with various synoptic situations<br />
(Based on data of October to December 1967—71)<br />
(a)Goastal Andhra Pradesh<br />
Oct. <strong>No</strong>v. Dec.<br />
V A N V A N V A N*<br />
1. Storms and depressions 33 25 20 100 100 22 75 — 17<br />
2a.<br />
Low pressure areas (including low<br />
pressure waves) 50 12 23 — — 41 - - 33<br />
b.Upper air cyclonic circulation or trough - 13 5 - - -<br />
3. East—west oriented trough across<br />
— 50 —<br />
Peninsula, seasonal trough over<br />
Bay well—marked, trough of low<br />
pressure off Kerala coast 17 50 5.2 — — 37 - - 39<br />
4. Other features --- - - - - 25 50 11<br />
(b) Tamil Nadu<br />
Oct. <strong>No</strong>v. Dec.<br />
V A N V A N V A N*<br />
1. Storms and depressions 83 15 7 45 8 15 57 10 14<br />
2a.Low pressure areas (including 17 53 39 55 67 31 43 50 42<br />
low pressure waves) trough<br />
b. Upper air cyclonic circulation or 0 5 5 — 10 —<br />
3. East—west oriented trough across<br />
Peninsula, seasonal trough over<br />
Bay well-marked, trough of low<br />
pressure off Kerala coast 0 27 49 — 25 54 — 30 37<br />
4.<br />
* V - Vigorous Monsoon; A - Active Monsoon; N - <strong>No</strong>rmal Monsoon