Create successful ePaper yourself
Turn your PDF publications into a flip-book with our unique Google optimized e-Paper software.
42<br />
Port Blair and also in the pressure field.<br />
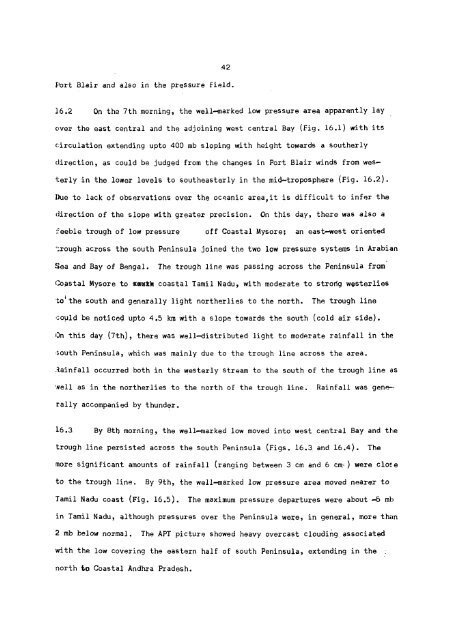
16.2 On the 7th morning, the well-marked low pressure area apparently lay<br />
over the east central and the adjoining west central Bay (Fig. 16.1) with its<br />
circulation extending upto 400 mb sloping with height towards a southerly<br />
direction, as could be judged from the changes in Port Blair winds from westerly<br />
in the lower levels to southeasterly in the mid-troposphere (Fig. 16.2).<br />
Due to lack of observations over the oceanic area, it is difficult to infer the<br />
direction of the slope with greater precision. On this day, there was also a<br />
feeble trough of low pressure<br />
off Coastal Mysore; an east-west oriented<br />
trough across the south Peninsula joined the two low pressure systems in Arabian<br />
Sea and Bay of Bengal. The trough line was passing across the Peninsula from<br />
Coastal Mysore to<br />
coastal Tamil Nadu, with moderate to strong westerlies<br />
to the south and generally light northerlies to the north. The trough line<br />
could be noticed upto 4.5 km with a slope towards the south (cold air side).<br />
On this day (7th), there was well—distributed light to moderate rainfall in the<br />
•south Peninsula, which was mainly due to the trough line across the area.<br />
Rainfall occurred both in the westerly stream to the south of the trough line as<br />
well as in the northerlies to the north of the trough line. Rainfall was generally<br />
accompanied by thunder.<br />
16.3 By 8th morning, the well-marked low moved into west central Bay and the<br />
trough line persisted across the south Peninsula (Figs. 16.3 and 16.4). The<br />
more significant amounts of rainfall (ranging between 3 cm and 6 cm ) were close<br />
to the trough line. By 9th, the well-marked low pressure area moved nearer to<br />
Tamil Nadu coast (Fig. 16.5). The maximum pressure departures were about -5 mb<br />
in Tamil Nadu, although pressures over the Peninsula were, in general, more than<br />
2 mb below normal. The APT picture showed heavy overcast clouding associated<br />
with the low covering the eastern half of south Peninsula, extending in the<br />
north to Coastal Andhra Pradesh.


