City and County of Denver Municipal Airport System ANNUAL ...
City and County of Denver Municipal Airport System ANNUAL ...
City and County of Denver Municipal Airport System ANNUAL ...

Create successful ePaper yourself
Turn your PDF publications into a flip-book with our unique Google optimized e-Paper software.
<strong>City</strong> <strong>and</strong> <strong>County</strong> <strong>of</strong> <strong>Denver</strong><br />
<strong>Municipal</strong> <strong>Airport</strong> <strong>System</strong><br />
MANAGEMENT’S DISCUSSION AND ANALYSIS (UNAUDITED)<br />
December 31, 2010 <strong>and</strong> 2009<br />
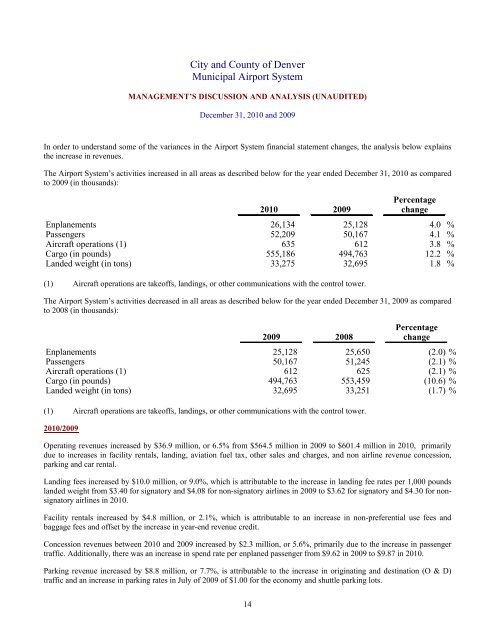
In order to underst<strong>and</strong> some <strong>of</strong> the variances in the <strong>Airport</strong> <strong>System</strong> financial statement changes, the analysis below explains<br />
the increase in revenues.<br />
The <strong>Airport</strong> <strong>System</strong>’s activities increased in all areas as described below for the year ended December 31, 2010 as compared<br />
to 2009 (in thous<strong>and</strong>s):<br />
Percentage<br />
2010 2009 change<br />
Enplanements 26,134 25,128 4.0 %<br />
Passengers 52,209 50,167 4.1 %<br />
Aircraft operations (1) 635 612 3.8 %<br />
Cargo (in pounds) 555,186 494,763 12.2 %<br />
L<strong>and</strong>ed weight (in tons) 33,275 32,695 1.8 %<br />
(1) Aircraft operations are take<strong>of</strong>fs, l<strong>and</strong>ings, or other communications with the control tower.<br />
The <strong>Airport</strong> <strong>System</strong>’s activities decreased in all areas as described below for the year ended December 31, 2009 as compared<br />
to 2008 (in thous<strong>and</strong>s):<br />
Percentage<br />
2009 2008 change<br />
Enplanements 25,128 25,650 (2.0) %<br />
Passengers 50,167 51,245 (2.1) %<br />
Aircraft operations (1) 612 625 (2.1) %<br />
Cargo (in pounds) 494,763 553,459 (10.6) %<br />
L<strong>and</strong>ed weight (in tons) 32,695 33,251 (1.7) %<br />
(1) Aircraft operations are take<strong>of</strong>fs, l<strong>and</strong>ings, or other communications with the control tower.<br />
2010/2009<br />
Operating revenues increased by $36.9 million, or 6.5% from $564.5 million in 2009 to $601.4 million in 2010, primarily<br />
due to increases in facility rentals, l<strong>and</strong>ing, aviation fuel tax, other sales <strong>and</strong> charges, <strong>and</strong> non airline revenue concession,<br />
parking <strong>and</strong> car rental.<br />
L<strong>and</strong>ing fees increased by $10.0 million, or 9.0%, which is attributable to the increase in l<strong>and</strong>ing fee rates per 1,000 pounds<br />
l<strong>and</strong>ed weight from $3.40 for signatory <strong>and</strong> $4.08 for non-signatory airlines in 2009 to $3.62 for signatory <strong>and</strong> $4.30 for nonsignatory<br />
airlines in 2010.<br />
Facility rentals increased by $4.8 million, or 2.1%, which is attributable to an increase in non-preferential use fees <strong>and</strong><br />
baggage fees <strong>and</strong> <strong>of</strong>fset by the increase in year-end revenue credit.<br />
Concession revenues between 2010 <strong>and</strong> 2009 increased by $2.3 million, or 5.6%, primarily due to the increase in passenger<br />
traffic. Additionally, there was an increase in spend rate per enplaned passenger from $9.62 in 2009 to $9.87 in 2010.<br />
Parking revenue increased by $8.8 million, or 7.7%, is attributable to the increase in originating <strong>and</strong> destination (O & D)<br />
traffic <strong>and</strong> an increase in parking rates in July <strong>of</strong> 2009 <strong>of</strong> $1.00 for the economy <strong>and</strong> shuttle parking lots.<br />
14