- Page 1 and 2:
ALTERNATIVE TESTING STRATEGIES PROG
- Page 3 and 4:
ALTERNATIVE TESTING STRATEGIES PROG
- Page 5 and 6:
TABLE OF CONTENTS 1. 2. EXECUTIVE S
- Page 7:
Update on EPA’s ToxCast Programme
- Page 10 and 11:
challenges, needs, and priorities f
- Page 13 and 14:
1INTRODUCTION It is the aim of the
- Page 15 and 16:
and progress of these multidiscipli
- Page 17 and 18:
Table 2. Members of the AXLR8 Scien
- Page 19:
• OECD Joint Meeting Special Sess
- Page 22 and 23:
ACuteTox Optimisation & Pre-Validat
- Page 24 and 25:
to robotic screening platforms; and
- Page 26 and 27:
ased on functional parameters inclu
- Page 28 and 29:
Table 1. Outliers identified by com
- Page 30 and 31:
showed that for some compounds the
- Page 32 and 33:
Computer-based prediction of metabo
- Page 34 and 35:
three reference compounds revealed
- Page 36 and 37:
a calibration curve constructed. Th
- Page 38 and 39:
cell lines) or 48 hours (A704 cells
- Page 40 and 41:
multivariate CART results did not c
- Page 42 and 43:
probability) ~50% of the substances
- Page 44 and 45:
Publications 2010-11 Hoffmann S, Ki
- Page 46 and 47:
Per Artursson Uppsala University Up
- Page 48 and 49:
their genotoxic and carcinogenic po
- Page 50 and 51:
Table 1. Overview of carcinoGENOMIC
- Page 52 and 53:
D12.23 3 monthly Project M42 √ Bo
- Page 54 and 55:
annual carcinoGENOMICS meeting in N
- Page 56 and 57:
M3.5 Decision of most M40 Postponed
- Page 58 and 59:
M3.4 Identification of most suitabl
- Page 60 and 61:
WP1 with input from other partners
- Page 62 and 63:
Partners Project Co-ordinator Jos K
- Page 64 and 65:
combine knowledge of critical proce
- Page 66 and 67:
defined and published in the form o
- Page 68 and 69:
WP6 is devoted to the setup of a so
- Page 70 and 71:
Partners Co-ordinator Bart van der
- Page 72 and 73:
obustness, comparing results obtain
- Page 74 and 75:
6. Candéias S, Pons B, Viau M, et
- Page 76 and 77:
ESNATS Embryonic Stem Cell-Based No
- Page 78 and 79:
Table 1. List of deliverables due i
- Page 80 and 81:
D3.3.1 Toxicity gene expression sig
- Page 82 and 83:
Table 2. List of milestones due in
- Page 84 and 85:
Table 3. Test systems corresponding
- Page 86 and 87:
Publications 2010-11 1. Peters SJ,
- Page 88 and 89:
Marcel Leist Universität Konstanz
- Page 90 and 91:
The most significant achievements o
- Page 92 and 93:
Figure 3. The Sensor Dish Reader (S
- Page 94 and 95:
LIINTOP Optimisation of Liver & Int
- Page 96 and 97:
cells express most of the functions
- Page 98 and 99:
Figure 3. Scheme of lentivirus gene
- Page 100 and 101:
Figure 5. Co-culture set-up. Functi
- Page 102 and 103:
Figure 9. Phalloidin-TRITC staining
- Page 104 and 105:
Table 1. Values are expressed as pe
- Page 106 and 107:
formed with mannitol, atenolol, pro
- Page 108 and 109:
Figure 14. Comparison of Digoxin an
- Page 110 and 111:
By using the new technology of HCA
- Page 112 and 113:
Figure 17. (Left panel) Phalloidin-
- Page 114 and 115:
limited amount of data could be pro
- Page 116 and 117:
André Guillouzo Institut National
- Page 118 and 119:
Objectives The overall aim of this
- Page 120 and 121:
Table 2: Milestones achieved in 201
- Page 122 and 123:
detected iron (µg/ml) 80 70 6
- Page 124 and 125:
in the following order: uncoated ma
- Page 126 and 127:
analysis of leukocytes, expression
- Page 128 and 129:
2011 the automated protocols will b
- Page 130 and 131:
OpenTox Promotion, Development, Acc
- Page 132 and 133:
Results The OpenTox Framework The O
- Page 134 and 135:
Figure 1. ToxPredict: OpenTox Appli
- Page 136 and 137:
scientifically sound manner, so as
- Page 138 and 139:
Figure 4. Creating a QPRF report wi
- Page 140 and 141:
Figure 7. MaxTox model-building app
- Page 142 and 143:
Figure 8. Bioclipse interaction wit
- Page 144 and 145:
and model predictions, which they m
- Page 146 and 147:
Publications 2010-11 1. Hardy B, Do
- Page 148 and 149:
In vitro toxicology using isolated
- Page 150 and 151:
(2C-Glo-CYP2C, 3A-Glo-CYP3A) while
- Page 152 and 153:
neuronal models 2D (primary culture
- Page 154 and 155:
10 and 14 days. The liver-specific
- Page 156 and 157:
Frédéric Bois Institut National d
- Page 158 and 159:
Figure 1. The Sens-it-iv sphere. 2.
- Page 160 and 161:
Figure 2. The updated modular struc
- Page 162 and 163:
Technology Module The aim of techno
- Page 164 and 165:
Table 1: The final compound list. R
- Page 166 and 167:
Table 2. The Sens-it-iv Toolbox. N
- Page 168 and 169:
Figure 4. A gene profile for identi
- Page 170 and 171:
Figure 7. In vitro T cell priming a
- Page 172 and 173:
sessions at congress and meetings (
- Page 174 and 175:
7. Gibbs S, van Montfrans C, Kroeze
- Page 176 and 177:
vitro assessment of allergens. Eds:
- Page 178 and 179:
S.F. Martin Universitätsklinikum F
- Page 180 and 181:
idging the gap to human volunteer s
- Page 182 and 183:
combinations of transcriptomics, me
- Page 184 and 185:
normal animals who usually exhibit
- Page 186 and 187:
Workshop proposals Concepts of data
- Page 188 and 189:
VITROCELLOMICS Reducing Animal Expe
- Page 190 and 191:
esulting of the project was the abi
- Page 192 and 193:
Figure 3. Four-compartment artifici
- Page 194 and 195:
embryonic stem cells differentiatin
- Page 196 and 197:
196 3AXLR8-2 WORKSHOP REPORT
- Page 198 and 199:
Workshop participants were divided
- Page 200 and 201:
08.45 - 09.15 ACuteTox Annette Kopp
- Page 202 and 203:
3.3 Workshop Presentations 202
- Page 204 and 205:
Table 1. A sampling of current toxi
- Page 206 and 207:
Table 2. EPA activities: a timeline
- Page 208 and 209:
Why is a Consortium Needed While th
- Page 210 and 211:
the development of new more relevan
- Page 212 and 213:
in particular for fundamental resea
- Page 214 and 215:
compared to controls. Most interest
- Page 216 and 217:
epidermis to known allergens and UV
- Page 218 and 219:
The Virtual Liver Spatial-Temporal
- Page 220 and 221:
A B C D E Figure 2. Tissue reconstr
- Page 222 and 223:
Figure 4. Mechanisms of how hepatoc
- Page 224 and 225:
in rat liver in vivo (Figure 5A). H
- Page 226 and 227:
The IMI eTOX Project Efforts to Dev
- Page 228 and 229:
deliverables, which can only be ach
- Page 230 and 231:
A series of publications related to
- Page 232 and 233:
Update on EPA’s ToxCast Programme
- Page 234 and 235: Phase I of ToxCast involved the eva
- Page 236 and 237: Endpoint Brief Description of Bioac
- Page 238 and 239: includes approximately 150 chemical
- Page 240 and 241: information. For each slice, distan
- Page 242 and 243: Judson RS, Houck KA, Kavlock RJ, et
- Page 244 and 245: Embryonic Stem Cell Approaches Towa
- Page 246 and 247: perhaps be tested efficiently in al
- Page 248 and 249: compared gene and protein expressio
- Page 250 and 251: cost and time, allowing more chemic
- Page 252 and 253: Toxicol Appl Pharmacol. 2011; 251,
- Page 254 and 255: functions, establish relationships
- Page 256 and 257: cellular behaviours are captured fr
- Page 258 and 259: assay. PLoS One. 2011; 6, e18540. 7
- Page 260 and 261: learning algorithm called Support V
- Page 262 and 263: Compound Potency Vehicle Concentrat
- Page 264 and 265: mediated inhibition of RXR function
- Page 266 and 267: References Basketter DA, Evans P, F
- Page 268 and 269: When considering consumer exposure,
- Page 270 and 271: in the induction of skin sensitisat
- Page 272 and 273: has reacted, when the peptide deple
- Page 274 and 275: of presentations and discussions, t
- Page 276 and 277: Contact Dermatitis. 2005; 53. 16. S
- Page 278 and 279: the development of in vitro assays.
- Page 280 and 281: Although the mechanisms underlying
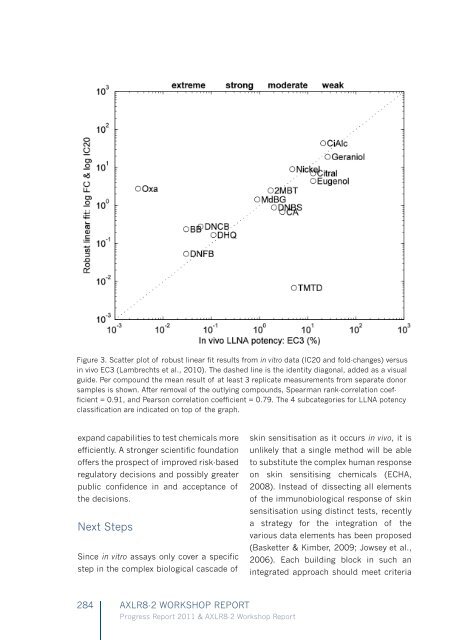
- Page 282 and 283: skin sensitisation, it will aid in
- Page 286 and 287: 7. De Smedt A, Van Den Heuvel R, Va
- Page 288 and 289: The OECD Adverse Outcome Pathway Ap
- Page 290 and 291: the AOP can be used in qualitative
- Page 292 and 293: Table 1. Summary of the experimenta
- Page 294 and 295: the significance of type 1 versus t
- Page 296 and 297: plus the key events that occur acro
- Page 298 and 299: Dimitrov, S.D., Low, L.K., Patlewic
- Page 300 and 301: [Supporting information and databas
- Page 302 and 303: Figure 1. Strategic R&D of chemical
- Page 304 and 305: The Bhas 42 system can sensitively
- Page 306 and 307: Table 1. Established reporter cell
- Page 308 and 309: elated genes (Hand1, ADAM19, Cmyal,
- Page 310 and 311: Publications Carcinogenicity Tanaka
- Page 312 and 313: Case Study Approaches for Implement
- Page 314 and 315: assay results together with CSBP mo
- Page 316 and 317: them to support multi-day testing i
- Page 318 and 319: CSBP models for both receptor-media
- Page 320 and 321: Hamner Presentations in 2011 • Ch
- Page 322 and 323: human health risk assessment. Risk
- Page 324 and 325: There is a significant scientific c
- Page 326 and 327: phototoxicity and eye irritation, f
- Page 328 and 329: allergy risk assessment rather than
- Page 330 and 331: ‘toolbox’ of non-animal methods
- Page 332 and 333: 332 3.4 Breakout Group Reports
- Page 334 and 335:
Figure 1. An illustration of the me
- Page 336 and 337:
methods, and the generally poor und
- Page 338 and 339:
3.4.3. Break-Out Group 2: Reproduct
- Page 340 and 341:
- Deep-sequencing of birth defect p
- Page 342 and 343:
Figure 2. Specific stages of the ma
- Page 344 and 345:
3.4.4 Break-Out Group 3: Skin Sensi
- Page 346 and 347:
for further progress. Better tools
- Page 348 and 349:
sure doses is not straightforward.
- Page 350 and 351:
3.5 AXLR8 Scientific Panel Recommen
- Page 352 and 353:
Workshop participants underlined th
- Page 354 and 355:
could be co-ordinated in a focused
- Page 356 and 357:
focusing on scientific excellence a
- Page 358 and 359:
Directory of Projects & Co-ordinato
- Page 360 and 361:
Glossary of Terms 2D/3D 3Rs CARDAM/
- Page 362:
362