Strategic Housing Market Assessment - North Devon District Council
Strategic Housing Market Assessment - North Devon District Council
Strategic Housing Market Assessment - North Devon District Council

You also want an ePaper? Increase the reach of your titles
YUMPU automatically turns print PDFs into web optimized ePapers that Google loves.
SHMA: Torridge and <strong>North</strong> <strong>Devon</strong> Update<br />
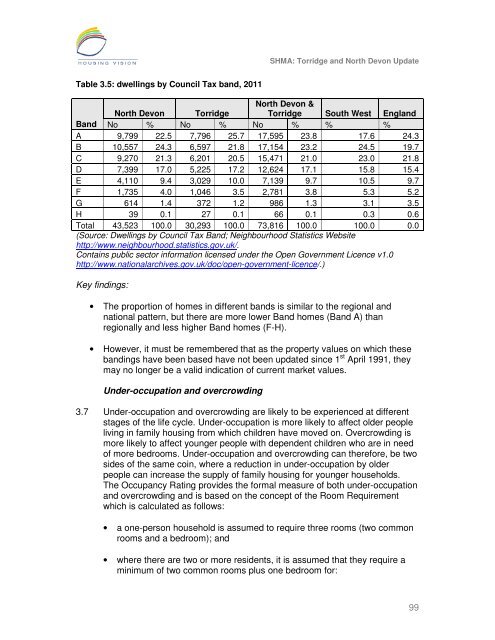
Table 3.5: dwellings by <strong>Council</strong> Tax band, 2011<br />
<strong>North</strong> <strong>Devon</strong> Torridge<br />
<strong>North</strong> <strong>Devon</strong> &<br />
Torridge South West England<br />
Band No % No % No % % %<br />
A 9,799 22.5 7,796 25.7 17,595 23.8 17.6 24.3<br />
B 10,557 24.3 6,597 21.8 17,154 23.2 24.5 19.7<br />
C 9,270 21.3 6,201 20.5 15,471 21.0 23.0 21.8<br />
D 7,399 17.0 5,225 17.2 12,624 17.1 15.8 15.4<br />
E 4,110 9.4 3,029 10.0 7,139 9.7 10.5 9.7<br />
F 1,735 4.0 1,046 3.5 2,781 3.8 5.3 5.2<br />
G 614 1.4 372 1.2 986 1.3 3.1 3.5<br />
H 39 0.1 27 0.1 66 0.1 0.3 0.6<br />
Total 43,523 100.0 30,293 100.0 73,816 100.0 100.0 0.0<br />
(Source: Dwellings by <strong>Council</strong> Tax Band; Neighbourhood Statistics Website<br />
http://www.neighbourhood.statistics.gov.uk/.<br />
Contains public sector information licensed under the Open Government Licence v1.0<br />
http://www.nationalarchives.gov.uk/doc/open-government-licence/.)<br />
Key findings:<br />
• The proportion of homes in different bands is similar to the regional and<br />
national pattern, but there are more lower Band homes (Band A) than<br />
regionally and less higher Band homes (F-H).<br />
• However, it must be remembered that as the property values on which these<br />
bandings have been based have not been updated since 1 st April 1991, they<br />
may no longer be a valid indication of current market values.<br />
Under-occupation and overcrowding<br />
3.7 Under-occupation and overcrowding are likely to be experienced at different<br />
stages of the life cycle. Under-occupation is more likely to affect older people<br />
living in family housing from which children have moved on. Overcrowding is<br />
more likely to affect younger people with dependent children who are in need<br />
of more bedrooms. Under-occupation and overcrowding can therefore, be two<br />
sides of the same coin, where a reduction in under-occupation by older<br />
people can increase the supply of family housing for younger households.<br />
The Occupancy Rating provides the formal measure of both under-occupation<br />
and overcrowding and is based on the concept of the Room Requirement<br />
which is calculated as follows:<br />
• a one-person household is assumed to require three rooms (two common<br />
rooms and a bedroom); and<br />
• where there are two or more residents, it is assumed that they require a<br />
minimum of two common rooms plus one bedroom for:<br />
99