Strategic Housing Market Assessment - North Devon District Council
Strategic Housing Market Assessment - North Devon District Council
Strategic Housing Market Assessment - North Devon District Council
Create successful ePaper yourself
Turn your PDF publications into a flip-book with our unique Google optimized e-Paper software.
SHMA: Torridge and <strong>North</strong> <strong>Devon</strong> Update<br />
• Reductions in projected population are largest in the age bands 35-54,<br />
when people are most likely to have a home of their own, and which<br />
implies a lesser requirement for housing from this age group; and<br />
• Reductions are projected to affect young families least.<br />
Comparing the 2008-based and 2010-based population projections<br />
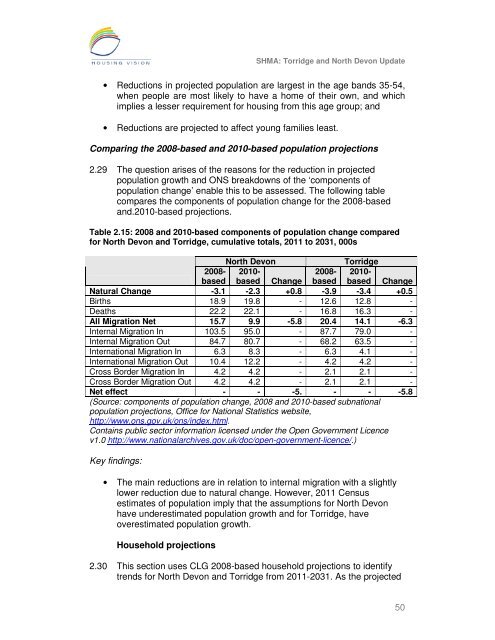
2.29 The question arises of the reasons for the reduction in projected<br />
population growth and ONS breakdowns of the ‘components of<br />
population change’ enable this to be assessed. The following table<br />
compares the components of population change for the 2008-based<br />
and.2010-based projections.<br />
Table 2.15: 2008 and 2010-based components of population change compared<br />
for <strong>North</strong> <strong>Devon</strong> and Torridge, cumulative totals, 2011 to 2031, 000s<br />
<strong>North</strong> <strong>Devon</strong><br />
Torridge<br />
2008-<br />
based<br />
2010-<br />
based Change<br />
2008-<br />
based<br />
2010-<br />
based Change<br />
Natural Change -3.1 -2.3 +0.8 -3.9 -3.4 +0.5<br />
Births 18.9 19.8 - 12.6 12.8 -<br />
Deaths 22.2 22.1 - 16.8 16.3 -<br />
All Migration Net 15.7 9.9 -5.8 20.4 14.1 -6.3<br />
Internal Migration In 103.5 95.0 - 87.7 79.0 -<br />
Internal Migration Out 84.7 80.7 - 68.2 63.5 -<br />
International Migration In 6.3 8.3 - 6.3 4.1 -<br />
International Migration Out 10.4 12.2 - 4.2 4.2 -<br />
Cross Border Migration In 4.2 4.2 - 2.1 2.1 -<br />
Cross Border Migration Out 4.2 4.2 - 2.1 2.1 -<br />
Net effect - - -5. - - -5.8<br />
(Source: components of population change, 2008 and 2010-based subnational<br />
population projections, Office for National Statistics website,<br />
http://www.ons.gov.uk/ons/index.html.<br />
Contains public sector information licensed under the Open Government Licence<br />
v1.0 http://www.nationalarchives.gov.uk/doc/open-government-licence/.)<br />
Key findings:<br />
• The main reductions are in relation to internal migration with a slightly<br />
lower reduction due to natural change. However, 2011 Census<br />
estimates of population imply that the assumptions for <strong>North</strong> <strong>Devon</strong><br />
have underestimated population growth and for Torridge, have<br />
overestimated population growth.<br />
Household projections<br />
2.30 This section uses CLG 2008-based household projections to identify<br />
trends for <strong>North</strong> <strong>Devon</strong> and Torridge from 2011-2031. As the projected<br />
50


