Strategic Housing Market Assessment - North Devon District Council
Strategic Housing Market Assessment - North Devon District Council
Strategic Housing Market Assessment - North Devon District Council
Create successful ePaper yourself
Turn your PDF publications into a flip-book with our unique Google optimized e-Paper software.
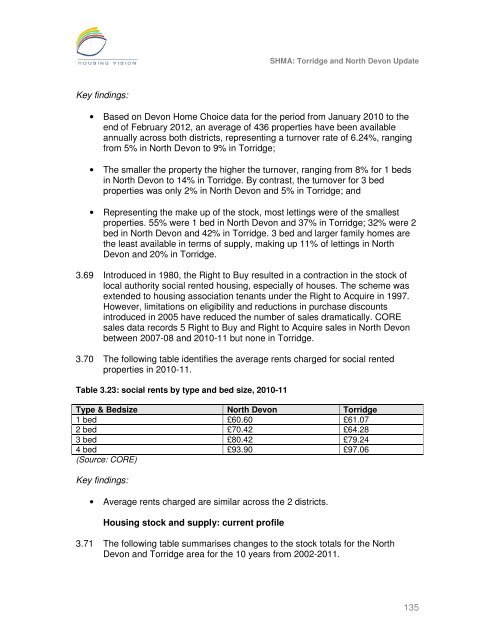
SHMA: Torridge and <strong>North</strong> <strong>Devon</strong> Update<br />
Key findings:<br />
• Based on <strong>Devon</strong> Home Choice data for the period from January 2010 to the<br />
end of February 2012, an average of 436 properties have been available<br />
annually across both districts, representing a turnover rate of 6.24%, ranging<br />
from 5% in <strong>North</strong> <strong>Devon</strong> to 9% in Torridge;<br />
• The smaller the property the higher the turnover, ranging from 8% for 1 beds<br />
in <strong>North</strong> <strong>Devon</strong> to 14% in Torridge. By contrast, the turnover for 3 bed<br />
properties was only 2% in <strong>North</strong> <strong>Devon</strong> and 5% in Torridge; and<br />
• Representing the make up of the stock, most lettings were of the smallest<br />
properties. 55% were 1 bed in <strong>North</strong> <strong>Devon</strong> and 37% in Torridge; 32% were 2<br />
bed in <strong>North</strong> <strong>Devon</strong> and 42% in Torridge. 3 bed and larger family homes are<br />
the least available in terms of supply, making up 11% of lettings in <strong>North</strong><br />
<strong>Devon</strong> and 20% in Torridge.<br />
3.69 Introduced in 1980, the Right to Buy resulted in a contraction in the stock of<br />
local authority social rented housing, especially of houses. The scheme was<br />
extended to housing association tenants under the Right to Acquire in 1997.<br />
However, limitations on eligibility and reductions in purchase discounts<br />
introduced in 2005 have reduced the number of sales dramatically. CORE<br />
sales data records 5 Right to Buy and Right to Acquire sales in <strong>North</strong> <strong>Devon</strong><br />
between 2007-08 and 2010-11 but none in Torridge.<br />
3.70 The following table identifies the average rents charged for social rented<br />
properties in 2010-11.<br />
Table 3.23: social rents by type and bed size, 2010-11<br />
Type & Bedsize <strong>North</strong> <strong>Devon</strong> Torridge<br />
1 bed £60.60 £61.07<br />
2 bed £70.42 £64.28<br />
3 bed £80.42 £79.24<br />
4 bed £93.90 £97.06<br />
(Source: CORE)<br />
Key findings:<br />
• Average rents charged are similar across the 2 districts.<br />
<strong>Housing</strong> stock and supply: current profile<br />
3.71 The following table summarises changes to the stock totals for the <strong>North</strong><br />
<strong>Devon</strong> and Torridge area for the 10 years from 2002-2011.<br />
135


