Strategic Housing Market Assessment - North Devon District Council
Strategic Housing Market Assessment - North Devon District Council
Strategic Housing Market Assessment - North Devon District Council

Create successful ePaper yourself
Turn your PDF publications into a flip-book with our unique Google optimized e-Paper software.
SHMA: Torridge and <strong>North</strong> <strong>Devon</strong> Update<br />
Key findings:<br />
• In 2010-11, 98% of lettings were to White applicants, 96% to people who<br />
identified themselves as White British; just over 2% to other White applicants,<br />
and just under 2% to other ethnic groups.<br />
• This compares with a total White population in <strong>North</strong> <strong>Devon</strong> and Torridge<br />
estimated data to be 96% in 2009.<br />
Who is being housed in the intermediate housing sector<br />
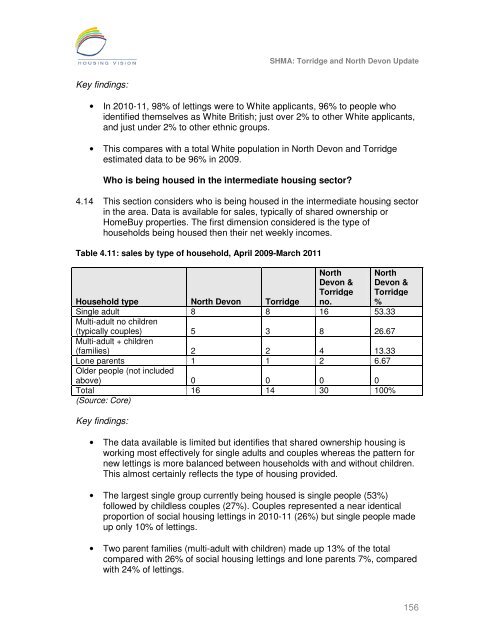
4.14 This section considers who is being housed in the intermediate housing sector<br />
in the area. Data is available for sales, typically of shared ownership or<br />
HomeBuy properties. The first dimension considered is the type of<br />
households being housed then their net weekly incomes.<br />
Table 4.11: sales by type of household, April 2009-March 2011<br />
<strong>North</strong><br />
<strong>Devon</strong> &<br />
Torridge<br />
no.<br />
<strong>North</strong><br />
<strong>Devon</strong> &<br />
Torridge<br />
%<br />
Household type <strong>North</strong> <strong>Devon</strong> Torridge<br />
Single adult 8 8 16 53.33<br />
Multi-adult no children<br />
(typically couples) 5 3 8 26.67<br />
Multi-adult + children<br />
(families) 2 2 4 13.33<br />
Lone parents 1 1 2 6.67<br />
Older people (not included<br />
above) 0 0 0 0<br />
Total 16 14 30 100%<br />
(Source: Core)<br />
Key findings:<br />
• The data available is limited but identifies that shared ownership housing is<br />
working most effectively for single adults and couples whereas the pattern for<br />
new lettings is more balanced between households with and without children.<br />
This almost certainly reflects the type of housing provided.<br />
• The largest single group currently being housed is single people (53%)<br />
followed by childless couples (27%). Couples represented a near identical<br />
proportion of social housing lettings in 2010-11 (26%) but single people made<br />
up only 10% of lettings.<br />
• Two parent families (multi-adult with children) made up 13% of the total<br />
compared with 26% of social housing lettings and lone parents 7%, compared<br />
with 24% of lettings.<br />
156