Strategic Housing Market Assessment - North Devon District Council
Strategic Housing Market Assessment - North Devon District Council
Strategic Housing Market Assessment - North Devon District Council

You also want an ePaper? Increase the reach of your titles
YUMPU automatically turns print PDFs into web optimized ePapers that Google loves.
SHMA: Torridge and <strong>North</strong> <strong>Devon</strong> Update<br />
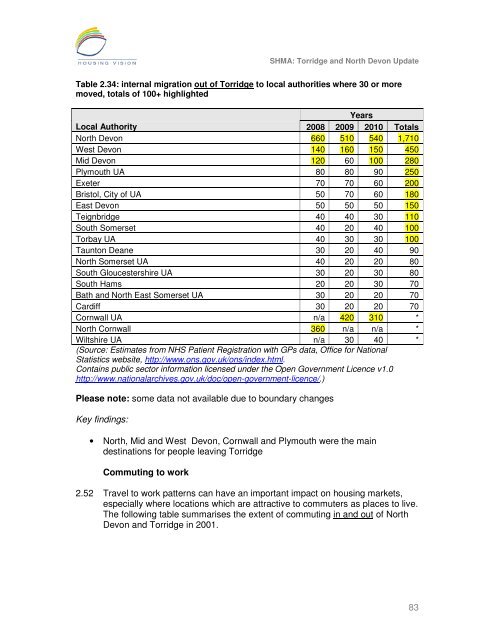
Table 2.34: internal migration out of Torridge to local authorities where 30 or more<br />
moved, totals of 100+ highlighted<br />
Years<br />
Local Authority 2008 2009 2010 Totals<br />
<strong>North</strong> <strong>Devon</strong> 660 510 540 1,710<br />
West <strong>Devon</strong> 140 160 150 450<br />
Mid <strong>Devon</strong> 120 60 100 280<br />
Plymouth UA 80 80 90 250<br />
Exeter 70 70 60 200<br />
Bristol, City of UA 50 70 60 180<br />
East <strong>Devon</strong> 50 50 50 150<br />
Teignbridge 40 40 30 110<br />
South Somerset 40 20 40 100<br />
Torbay UA 40 30 30 100<br />
Taunton Deane 30 20 40 90<br />
<strong>North</strong> Somerset UA 40 20 20 80<br />
South Gloucestershire UA 30 20 30 80<br />
South Hams 20 20 30 70<br />
Bath and <strong>North</strong> East Somerset UA 30 20 20 70<br />
Cardiff 30 20 20 70<br />
Cornwall UA n/a 420 310 *<br />
<strong>North</strong> Cornwall 360 n/a n/a *<br />
Wiltshire UA n/a 30 40 *<br />
(Source: Estimates from NHS Patient Registration with GPs data, Office for National<br />
Statistics website, http://www.ons.gov.uk/ons/index.html.<br />
Contains public sector information licensed under the Open Government Licence v1.0<br />
http://www.nationalarchives.gov.uk/doc/open-government-licence/.)<br />
Please note: some data not available due to boundary changes<br />
Key findings:<br />
• <strong>North</strong>, Mid and West <strong>Devon</strong>, Cornwall and Plymouth were the main<br />
destinations for people leaving Torridge<br />
Commuting to work<br />
2.52 Travel to work patterns can have an important impact on housing markets,<br />
especially where locations which are attractive to commuters as places to live.<br />
The following table summarises the extent of commuting in and out of <strong>North</strong><br />
<strong>Devon</strong> and Torridge in 2001.<br />
83