Strategic Housing Market Assessment - North Devon District Council
Strategic Housing Market Assessment - North Devon District Council
Strategic Housing Market Assessment - North Devon District Council

You also want an ePaper? Increase the reach of your titles
YUMPU automatically turns print PDFs into web optimized ePapers that Google loves.
SHMA: Torridge and <strong>North</strong> <strong>Devon</strong> Update<br />
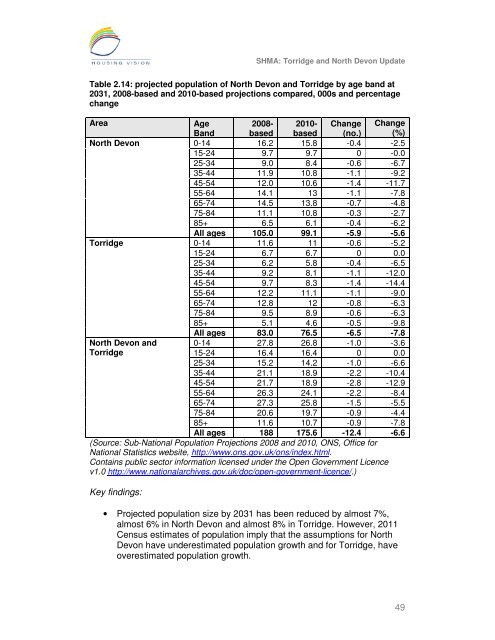
Table 2.14: projected population of <strong>North</strong> <strong>Devon</strong> and Torridge by age band at<br />
2031, 2008-based and 2010-based projections compared, 000s and percentage<br />
change<br />
Area<br />
<strong>North</strong> <strong>Devon</strong><br />
Torridge<br />
<strong>North</strong> <strong>Devon</strong> and<br />
Torridge<br />
Age<br />
Band<br />
2008-<br />
based<br />
2010-<br />
based<br />
Change<br />
(no.)<br />
Change<br />
(%)<br />
0-14 16.2 15.8 -0.4 -2.5<br />
15-24 9.7 9.7 0 -0.0<br />
25-34 9.0 8.4 -0.6 -6.7<br />
35-44 11.9 10.8 -1.1 -9.2<br />
45-54 12.0 10.6 -1.4 -11.7<br />
55-64 14.1 13 -1.1 -7.8<br />
65-74 14.5 13.8 -0.7 -4.8<br />
75-84 11.1 10.8 -0.3 -2.7<br />
85+ 6.5 6.1 -0.4 -6.2<br />
All ages 105.0 99.1 -5.9 -5.6<br />
0-14 11.6 11 -0.6 -5.2<br />
15-24 6.7 6.7 0 0.0<br />
25-34 6.2 5.8 -0.4 -6.5<br />
35-44 9.2 8.1 -1.1 -12.0<br />
45-54 9.7 8.3 -1.4 -14.4<br />
55-64 12.2 11.1 -1.1 -9.0<br />
65-74 12.8 12 -0.8 -6.3<br />
75-84 9.5 8.9 -0.6 -6.3<br />
85+ 5.1 4.6 -0.5 -9.8<br />
All ages 83.0 76.5 -6.5 -7.8<br />
0-14 27.8 26.8 -1.0 -3.6<br />
15-24 16.4 16.4 0 0.0<br />
25-34 15.2 14.2 -1.0 -6.6<br />
35-44 21.1 18.9 -2.2 -10.4<br />
45-54 21.7 18.9 -2.8 -12.9<br />
55-64 26.3 24.1 -2.2 -8.4<br />
65-74 27.3 25.8 -1.5 -5.5<br />
75-84 20.6 19.7 -0.9 -4.4<br />
85+ 11.6 10.7 -0.9 -7.8<br />
All ages 188 175.6 -12.4 -6.6<br />
(Source: Sub-National Population Projections 2008 and 2010, ONS, Office for<br />
National Statistics website, http://www.ons.gov.uk/ons/index.html.<br />
Contains public sector information licensed under the Open Government Licence<br />
v1.0 http://www.nationalarchives.gov.uk/doc/open-government-licence/.)<br />
Key findings:<br />
• Projected population size by 2031 has been reduced by almost 7%,<br />
almost 6% in <strong>North</strong> <strong>Devon</strong> and almost 8% in Torridge. However, 2011<br />
Census estimates of population imply that the assumptions for <strong>North</strong><br />
<strong>Devon</strong> have underestimated population growth and for Torridge, have<br />
overestimated population growth.<br />
49