Strategic Housing Market Assessment - North Devon District Council
Strategic Housing Market Assessment - North Devon District Council
Strategic Housing Market Assessment - North Devon District Council

Create successful ePaper yourself
Turn your PDF publications into a flip-book with our unique Google optimized e-Paper software.
SHMA: Torridge and <strong>North</strong> <strong>Devon</strong> Update<br />
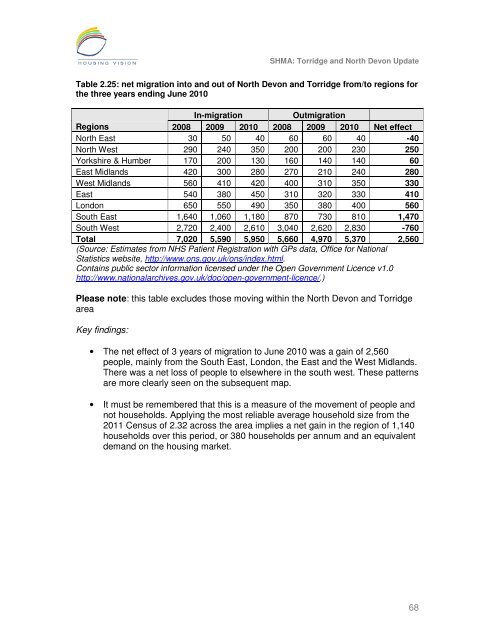
Table 2.25: net migration into and out of <strong>North</strong> <strong>Devon</strong> and Torridge from/to regions for<br />
the three years ending June 2010<br />
In-migration<br />
Outmigration<br />
Regions 2008 2009 2010 2008 2009 2010 Net effect<br />
<strong>North</strong> East 30 50 40 60 60 40 -40<br />
<strong>North</strong> West 290 240 350 200 200 230 250<br />
Yorkshire & Humber 170 200 130 160 140 140 60<br />
East Midlands 420 300 280 270 210 240 280<br />
West Midlands 560 410 420 400 310 350 330<br />
East 540 380 450 310 320 330 410<br />
London 650 550 490 350 380 400 560<br />
South East 1,640 1,060 1,180 870 730 810 1,470<br />
South West 2,720 2,400 2,610 3,040 2,620 2,830 -760<br />
Total 7,020 5,590 5,950 5,660 4,970 5,370 2,560<br />
(Source: Estimates from NHS Patient Registration with GPs data, Office for National<br />
Statistics website, http://www.ons.gov.uk/ons/index.html.<br />
Contains public sector information licensed under the Open Government Licence v1.0<br />
http://www.nationalarchives.gov.uk/doc/open-government-licence/.)<br />
Please note: this table excludes those moving within the <strong>North</strong> <strong>Devon</strong> and Torridge<br />
area<br />
Key findings:<br />
• The net effect of 3 years of migration to June 2010 was a gain of 2,560<br />
people, mainly from the South East, London, the East and the West Midlands.<br />
There was a net loss of people to elsewhere in the south west. These patterns<br />
are more clearly seen on the subsequent map.<br />
• It must be remembered that this is a measure of the movement of people and<br />
not households. Applying the most reliable average household size from the<br />
2011 Census of 2.32 across the area implies a net gain in the region of 1,140<br />
households over this period, or 380 households per annum and an equivalent<br />
demand on the housing market.<br />
68