Annual Report 2001 - Carlsberg Group
Annual Report 2001 - Carlsberg Group
Annual Report 2001 - Carlsberg Group

You also want an ePaper? Increase the reach of your titles
YUMPU automatically turns print PDFs into web optimized ePapers that Google loves.
32<br />
Regional <strong>Report</strong>s - Western Europe<br />
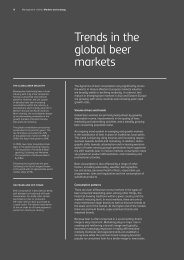
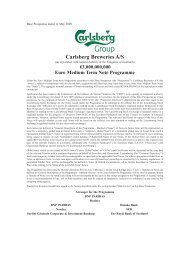
Western Europe<br />
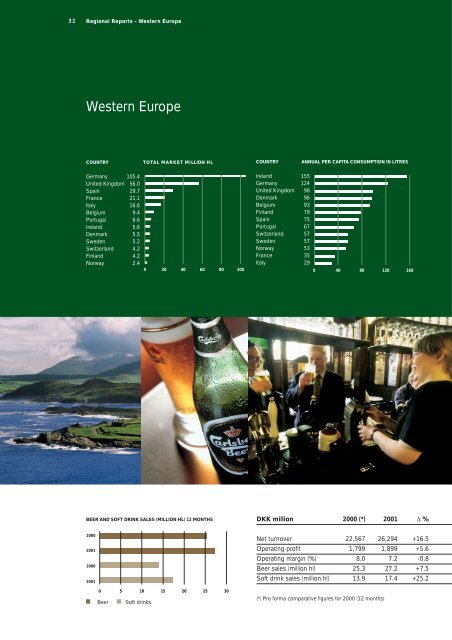
COUNTRY TOTAL MARKET MILLION HL<br />
COUNTRY<br />
ANNUAL PER CAPITA CONSUMPTION IN LITRES<br />
Germany 105.4<br />
United Kingdom 56.0<br />
Spain 29.7<br />
France 21.1<br />
Italy 16.6<br />
Belgium 9.4<br />
Portugal 6.6<br />
Ireland 5.6<br />
Denmark 5.5<br />
Sweden 5.2<br />
Switzerland 4.2<br />
Finland 4.2<br />
Norway 2.4<br />
Ireland 155<br />
Germany 124<br />
United Kingdom 98<br />
Denmark 96<br />
Belgium 93<br />
Finland 79<br />
Spain 75<br />
Portugal 67<br />
Switzerland 57<br />
Sweden 57<br />
Norway 53<br />
France 35<br />
Italy 29<br />
0 20 40 60 80 100 0 40 80 120 160<br />
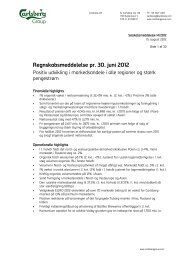
BEER AND SOFT DRINK SALES (MILLION HL) 12 MONTHS<br />
DKK million 2000 (*) <strong>2001</strong> ∆ %<br />
2000<br />
<strong>2001</strong><br />
2000<br />
<strong>2001</strong><br />
0 5 10 15 20 25 30<br />
Beer Soft drinks<br />
Net turnover 22,567 26,294 +16.5<br />
Operating profit 1,799 1,899 +5.6<br />
Operating margin (%) 8.0 7.2 -0.8<br />
Beer sales (million hl) 25.3 27.2 +7.5<br />
Soft drink sales (million hl) 13.9 17.4 +25.2<br />
(*) Pro forma comparative figures for 2000 (12 months)

![[Name and Address] - Carlsberg Group](https://img.yumpu.com/49766377/1/184x260/name-and-address-carlsberg-group.jpg?quality=85)
![[Name and Address] - Carlsberg Group](https://img.yumpu.com/49015962/1/184x260/name-and-address-carlsberg-group.jpg?quality=85)