April Journal-2009.p65 - Association of Biotechnology and Pharmacy
April Journal-2009.p65 - Association of Biotechnology and Pharmacy
April Journal-2009.p65 - Association of Biotechnology and Pharmacy

Create successful ePaper yourself
Turn your PDF publications into a flip-book with our unique Google optimized e-Paper software.
Current Trends in <strong>Biotechnology</strong> <strong>and</strong> <strong>Pharmacy</strong><br />
Vol. 3 (2) 149-154, <strong>April</strong> 2009. ISSN 0973-8916<br />
(CI0), First-order connectivity index (CI1),<br />
Second-order connectivity index (CI2), dipole<br />
moment (DM), total energy at its current<br />
geometry after optimization <strong>of</strong> structure (TE), heat<br />
<strong>of</strong> formation at its current geometry after<br />
optimization <strong>of</strong> structure (HF), ionization potential<br />
(IP), electron affinity (EA), octanol-water partition<br />
coefficient(logP), molar refractivity(MR), shape<br />
index order 1 (SI1), shape index order 2 (SI2),<br />
shape index order 3 (SI3), Zero-order valance<br />
connectivity index (VCI0), First-order valance<br />
connectivity index (VCI1), Second-order valance<br />
connectivity index (VCI2). (Physicochemical<br />
parameters data will be provided on request).<br />
Results <strong>and</strong> Discussion<br />
The QSAR studies <strong>of</strong> the thiomethane<br />
series resulted in several QSAR equations. Intercorrelation<br />
between the descriptors involved in<br />
the QSAR model is ≤ 0.57. The best equation<br />
when we considered only one parameter is Eq.<br />
1.<br />
pIC 50<br />
= 4.336 (± 0.596) - 1.004 (± 0.151) logP<br />
(1)<br />
n =13, R= 0.895, R 2 = 0.802, R 2 = 0.783, SEE =<br />
adj<br />
0.264, F = 44.42, P < 0.001, q 2 = 0.726,<br />
S PRESS<br />
= 0.309, SDEP = 0.297.<br />
The above equation is statistically<br />
significant one. The R 2 <strong>and</strong> internal predictivity<br />
<strong>of</strong> the model is good. When we have considered<br />
the best equation containing two parameters is<br />
Eq. 2.<br />
pIC 50<br />
= -5.993 (± 4.613) - 0.831 (± 0.165) logP +<br />
1.075 (± 0.581) IP (2)<br />
n =13, R= 0.923, R 2 = 0.852, R 2 = 0.823, SEE =<br />
adj<br />
0.238, F = 28.80, P < 0.001, q 2 = 0.743,<br />
S PRESS<br />
= 0.299, SDEP = 0.287.<br />
When we considered three parameters<br />
for developing model, there was no significant<br />
improvement in R 2 <strong>and</strong> q 2 . Eq. 2 was selected as<br />
the best model on the basis <strong>of</strong> high q 2 values <strong>and</strong><br />
152<br />
R 2 value. The values given in the parentheses<br />
are 95% confidence intervals <strong>of</strong> the regression<br />
coefficients. Eq. 2 could explain 85.2% <strong>and</strong> predict<br />
74.3% <strong>of</strong> the variance <strong>of</strong> the HIV-1 protease<br />
inhibitory activity data. The calculated HIV-1<br />
protease inhibitory activity values by Eq.2 are given<br />
in table1. This model showed good correlation<br />
coefficient (R) <strong>of</strong> 0.923 between descriptors [logP<br />
<strong>and</strong> IP] <strong>and</strong> HIV-1 protease inhibitory activity.<br />
This model also indicates statistical significance<br />
> 99.9% with F value F (2,10)<br />
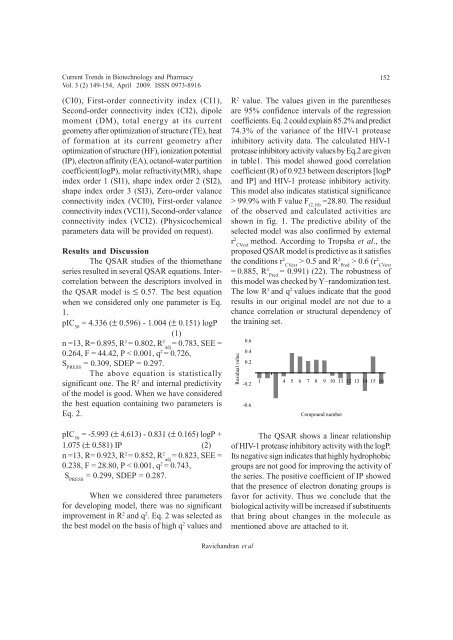
=28.80. The residual<br />
<strong>of</strong> the observed <strong>and</strong> calculated activities are<br />
shown in fig. 1. The predictive ability <strong>of</strong> the<br />
selected model was also confirmed by external<br />
r 2 method. According to Tropsha et al., the<br />
CVext<br />
proposed QSAR model is predictive as it satisfies<br />
the conditions r 2 > 0.5 <strong>and</strong> CVext R2 > 0.6 Pred (r2 CVext<br />
= 0.885, R2 = 0.991) (22). The robustness <strong>of</strong><br />
Pred<br />
this model was checked by Y–r<strong>and</strong>omization test.<br />
The low R 2 <strong>and</strong> q 2 values indicate that the good<br />
results in our original model are not due to a<br />
chance correlation or structural dependency <strong>of</strong><br />
the training set.<br />
Residual value<br />
0.6<br />
0.4<br />
0.2<br />
-0.2<br />
-0.6<br />
1 4 5 6 7 8 9 10 11 12 13 14 15 16<br />
Compound number<br />
The QSAR shows a linear relationship<br />
<strong>of</strong> HIV-1 protease inhibitory activity with the logP.<br />
Its negative sign indicates that highly hydrophobic<br />
groups are not good for improving the activity <strong>of</strong><br />
the series. The positive coefficient <strong>of</strong> IP showed<br />
that the presence <strong>of</strong> electron donating groups is<br />
favor for activity. Thus we conclude that the<br />
biological activity will be increased if substituents<br />
that bring about changes in the molecule as<br />
mentioned above are attached to it.<br />
Ravich<strong>and</strong>ran et al