Targeted After School Evaluation Report 2009-10 - San Francisco ...
Targeted After School Evaluation Report 2009-10 - San Francisco ...
Targeted After School Evaluation Report 2009-10 - San Francisco ...
- No tags were found...

You also want an ePaper? Increase the reach of your titles
YUMPU automatically turns print PDFs into web optimized ePapers that Google loves.
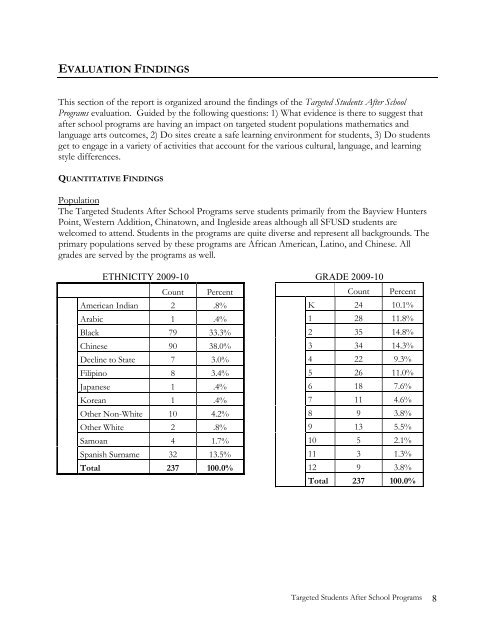
EVALUATION FINDINGS<br />
This section of the report is organized around the findings of the <strong>Targeted</strong> Students <strong>After</strong> <strong>School</strong><br />
Programs evaluation. Guided by the following questions: 1) What evidence is there to suggest that<br />
after school programs are having an impact on targeted student populations mathematics and<br />
language arts outcomes, 2) Do sites create a safe learning environment for students, 3) Do students<br />
get to engage in a variety of activities that account for the various cultural, language, and learning<br />
style differences.<br />
QUANTITATIVE FINDINGS<br />
Population<br />
The <strong>Targeted</strong> Students <strong>After</strong> <strong>School</strong> Programs serve students primarily from the Bayview Hunters<br />
Point, Western Addition, Chinatown, and Ingleside areas although all SFUSD students are<br />
welcomed to attend. Students in the programs are quite diverse and represent all backgrounds. The<br />
primary populations served by these programs are African American, Latino, and Chinese. All<br />
grades are served by the programs as well.<br />
ETHNICITY <strong>2009</strong>-<strong>10</strong><br />
Count Percent<br />
American Indian 2 .8%<br />
Arabic 1 .4%<br />
Black 79 33.3%<br />
Chinese 90 38.0%<br />
Decline to State 7 3.0%<br />
Filipino 8 3.4%<br />
Japanese 1 .4%<br />
Korean 1 .4%<br />
Other Non-White <strong>10</strong> 4.2%<br />
Other White 2 .8%<br />
Samoan 4 1.7%<br />
Spanish Surname 32 13.5%<br />
Total 237 <strong>10</strong>0.0%<br />
GRADE <strong>2009</strong>-<strong>10</strong><br />
Count Percent<br />
K 24 <strong>10</strong>.1%<br />
1 28 11.8%<br />
2 35 14.8%<br />
3 34 14.3%<br />
4 22 9.3%<br />
5 26 11.0%<br />
6 18 7.6%<br />
7 11 4.6%<br />
8 9 3.8%<br />
9 13 5.5%<br />
<strong>10</strong> 5 2.1%<br />
11 3 1.3%<br />
12 9 3.8%<br />
Total 237 <strong>10</strong>0.0%<br />
<strong>Targeted</strong> Students <strong>After</strong> <strong>School</strong> Programs 8