Targeted After School Evaluation Report 2009-10 - San Francisco ...
Targeted After School Evaluation Report 2009-10 - San Francisco ...
Targeted After School Evaluation Report 2009-10 - San Francisco ...
- No tags were found...
You also want an ePaper? Increase the reach of your titles
YUMPU automatically turns print PDFs into web optimized ePapers that Google loves.
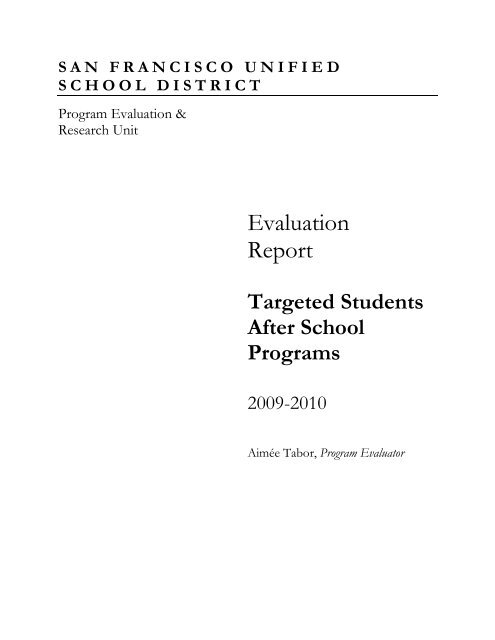
S A N F R A N C I S C O U N I F I E D<br />
S C H O O L D I S T R I C T<br />
Program <strong>Evaluation</strong> &<br />
Research Unit<br />
<strong>Evaluation</strong><br />
<strong>Report</strong><br />
<strong>Targeted</strong> Students<br />
<strong>After</strong> <strong>School</strong><br />
Programs<br />
<strong>2009</strong>-20<strong>10</strong><br />
Aimée Tabor, Program Evaluator
TABLE OF CONTENTS<br />
EXECUTIVE SUMMARY .......................................................................................................... 3<br />
SUMMARY OF FINDINGS .............................................................................................. 3<br />
PROGRAM DESIGN ................................................................................................................... 4<br />
PROGRAM DESCRIPTION .............................................................................................. 4<br />
PROGRAM OBJECTIVES ................................................................................................ 5<br />
PROGRAM STRATEGIES, RESOURCES AND ACTIVITIES ...................................... 5<br />
EVALUATION DESIGN ............................................................................................................. 6<br />
EVALUATION METHODOLOGY .................................................................................. 6<br />
EVALUATION OBJECTIVES .......................................................................................... 6<br />
DATA COLLECTION METHODS ................................................................................... 7<br />
DATA ANAYLYSIS .......................................................................................................... 7<br />
EVALUATION FINDINGS ......................................................................................................... 8<br />
LIMITATIONS OF THE DATA ...................................................................................... 13<br />
SUGGESTIONS TO CONSIDER FOR CONTINUAL IMPROVEMENT .......................... 14<br />
HOW CAN THE PROGRAM BE IMPROVED ............................................................ 14<br />
REFERENCES ............................................................................................................................ 15<br />
APPENDIX .................................................................................................................................. 16<br />
<strong>Targeted</strong> Students <strong>After</strong> <strong>School</strong> Programs 2
EXECUTIVE SUMMARY<br />
In this <strong>Targeted</strong> Students <strong>After</strong> <strong>School</strong> Programs evaluation report, there are three guiding questions: 1)<br />
What evidence is there to suggest that after school programs are having an impact on targeted<br />
student populations mathematic and language arts outcomes 2) Do sites create a safe learning<br />
environment for students 3) Do students get to engage in a variety of activities that account for the<br />
various cultural, language, and learning style differences<br />
SUMMARY OF FINDINGS<br />
<br />
<br />
<br />
<br />
<br />
<br />
<br />
The <strong>Targeted</strong> Students <strong>After</strong> <strong>School</strong> Programs served their targeted population of students<br />
with high needs for assistance: 33.3% of students were African American, 13.5% were<br />
Latino, 41.4% were English Language Learners, and 88% qualify for free and reduced lunch.<br />
Students who participated in the <strong>Targeted</strong> Students <strong>After</strong> <strong>School</strong> Programs showed an<br />
increase in English Language Arts scores on the California Standards Test. Mathematics<br />
scores on the California Standards test showed some decline.<br />
Grade point average for African American, Latino, and Samoan students showed an increase<br />
a statistically significant increase.<br />
Grade point average for high school students closest to graduation who participated in the<br />
<strong>Targeted</strong> Students <strong>After</strong> <strong>School</strong> Programs also showed a statistically significant increase.<br />
All students who participated had access to a variety of high quality activities from sports<br />
and the arts to longer fieldtrips.<br />
All students were supervised and provided with a safe and structured environment.<br />
Although African American and Latino students compose a significant portion of the<br />
<strong>Targeted</strong> Students <strong>After</strong> <strong>School</strong> Programs numbers have been steadily decreasing as part of<br />
the Consent Decree Population.<br />
<strong>Targeted</strong> Students <strong>After</strong> <strong>School</strong> Programs 3
PROGRAM DESIGN<br />
PROGRAM DESCRIPTIONS<br />
According to The <strong>After</strong>school Alliance and countless research studies, the hours between 3 p.m. and<br />
6 p.m. on school days are the peak hours for juvenile crime and experimentation with drugs, alcohol,<br />
cigarettes and other risky behaviors. By contrast, students who participate in after school<br />
programming have better academic outcomes, better social and emotional outcomes, better health<br />
and wellness outcomes, and reduced risk of delinquency, drug use, and risky sexual activity. In<br />
addition, parents with students in afterschool programs are less stressed, have fewer unscheduled<br />
absences and are more productive at work (<strong>After</strong> <strong>School</strong> Alliance, <strong>2009</strong>).<br />
The <strong>Targeted</strong> Students <strong>After</strong> <strong>School</strong> Programs are a set of community-based afterschool programs<br />
that attempt to engage youth in academics, increase their exposure to a variety of activities, and<br />
provide students with a safe space. These programs include the Citywide Tutorial Program, Ingleside<br />
Community Center, Ella Hill Hutch Community Center, and Providence Opportunity Program.<br />
CITYWIDE TUTORIAL PROGRAM<br />
The <strong>San</strong> <strong>Francisco</strong> Citywide Tutorial program is an after school program that operates two hours<br />
after school Monday through Thursday. Tutorial sites were located in or near community housing to<br />
serve some of <strong>San</strong> <strong>Francisco</strong> Unified <strong>School</strong> District targeted populations, including African<br />
American, Latino, and English Language Learners. Citywide Tutorial serves students from Ingleside,<br />
Bayview/Hunter Point, Western Addition, Crocker/Amazon and Chinatown. The mission of the<br />
program is to assist students with homework and to provide extended learning opportunities in the<br />
areas of reading, writing, math, and science.<br />
INGLESIDE COMMUNITY CENTER<br />
Ingleside Community Center is a faith-based after school program that provides after-school<br />
tutoring for underserved students who live in the Oceanview, Outer Mission, Lakeview and<br />
Ingleside areas. Students receive homework assistance and a rigorous program in Reading and<br />
Mathematics to supplement SFUSD school curriculum. In addition, the program takes students on<br />
several enrichment activities throughout the year during school break times.<br />
ELLA HILL HUTCH COMMUNITY CENTER<br />
The Ella Hill Hutch Community Center has a variety of programs which serve <strong>San</strong> <strong>Francisco</strong><br />
Unified <strong>School</strong> District students between the ages 6 - 19 who live in the Western Addition.<br />
Programs include an onsite tutoring program, youth basketball, culinary arts, and dance lessons. In<br />
addition, Ella Hill Hutch partners with other CBOs to provide programs such as business plan<br />
competitions, job placement activities, and college preparation activities.<br />
PROVIDENCE OPPORTUNITY PROGRAM<br />
The Providence Opportunity Program provides mentoring services to targeted students from<br />
elementary, middle and high school in the <strong>San</strong> <strong>Francisco</strong> Unified <strong>School</strong> District. The focus is on<br />
increasing the academic achievement, the attendance rate, and decreasing the suspension rates for<br />
non-expulsionable offences for students involved in the program. Program activities include: tutorial<br />
services/homework assistance; one-on-one counseling; parent participation meetings, school and<br />
home visits, and mentor training. Providence students are taken by referral and often have unique<br />
circumstances that put them at risk to graduate high school.<br />
<strong>Targeted</strong> Students <strong>After</strong> <strong>School</strong> Programs 4
PROGRAM OBJECTIVES<br />
The <strong>Targeted</strong> Students <strong>After</strong> <strong>School</strong> Programs have three main programmatic goals:<br />
1. To increase academic achievement and engagement in learning through tutoring, homework<br />
assistance, and extra practice in language arts and math.<br />
2. To provide a safe space after school where students can engage with one another and caring<br />
adults.<br />
3. To provide under achieving students exposure to extra curricular opportunities such as<br />
sports, dance, environmental science, and computers.<br />
PROGRAM STRATEGIES AND ACTIVITIES<br />
Recent research on successful after school programs suggests that they can and should include a<br />
wide variety of activities and foci. However, there are three components that must be included for<br />
positive youth outcomes: (a) access to and sustained participation in the program(s) (American<br />
Youth Policy Forum, 2006); (b) quality programming and staffing (Grossman Et. al., 2007); (c) a<br />
strong partnership between the program(s) and other places of students learning such as the school,<br />
the family, and other community services (Kakli Et. al., 2006).<br />
The program strategies and activities of the <strong>Targeted</strong> Students <strong>After</strong> <strong>School</strong> Programs for youth in the <strong>San</strong><br />
<strong>Francisco</strong> Unified <strong>School</strong> District serve to address and support:<br />
Increased Academic Achievement. The first focus is on academic achievement. All sites offer one-on-one<br />
or small group tutoring and homework assistance. Additionally, Citywide Tutorial and Ingleside<br />
Community Center provide extra practice and emphasis on Language Arts through Xtra Weekly and<br />
Math through an on-site math specialist.<br />
Increased Student Engagement in Learning. Students who are engaged in learning have higher attendance<br />
rates, less tardiness, and a better attitude toward school and higher educational aspirations (Harvard<br />
Family Research Project, 2008). Providence Opportunities Program and Ingleside Community<br />
Center offer project based learning activities that engage students in learning outside the classroom<br />
through activities such as building robots, computer modeling, and internships.<br />
Safe Space for Students. All sites have building facilities to house students during rain or shine. Sites are<br />
staffed by a variety of adults including SFUSD school teachers, SFUSD retired teachers,<br />
paraprofessionals, coaches, clergy and community volunteers. All sites provide students with healthy<br />
snacks or a hot meal after school. All sites focus on the safety of students in their care and<br />
relationships between adults and students in the program.<br />
Enrichment Activities. All sites attempt to expose students to activities that they may not have regular<br />
access to through school-based programming. Sites take students to museums, to working farms,<br />
and on camping trips. Some sites have on-site programs such as youth basketball, dance, music, and<br />
culinary arts.<br />
<strong>Targeted</strong> Students <strong>After</strong> <strong>School</strong> Programs 5
EVALUATION DESIGN<br />
EVALUATION METHODOLOGY<br />
At SFUSD, the Program <strong>Evaluation</strong> and Research Office employs an approach to evaluation that is<br />
participatory (Cousins & Earl, 1992), utilization-focused (Patton, 1986, 1994), and integrated with<br />
processes of continuous improvement and program planning (Fetterman, Kaftarian & Wandersman,<br />
1996). Our approach is based on the idea that participation of program directors and coordinators<br />
in the evaluation process is key to insuring that program planners and managers use evaluation data<br />
to support decision-making. The involvement of program directors and coordinators has the<br />
potential to encourage program staff to think more systematically about the relationship between<br />
program activities and objectives. Such systematic reflection would be aimed at building a “culture<br />
of learning” (Patton, 1997, p. 147) to lead to continuous program improvement.<br />
<strong>Evaluation</strong>s are designed to address both program implementation (formative evaluation) and<br />
outcomes (summative evaluation) and are question-driven. Evaluators and program staff collaborate<br />
to develop evaluation questions that are linked to the program objectives and activities, and to the<br />
interests of all program stakeholders. In addition, research on the best practices in the project’s<br />
domain of activity informs the evaluation framework. The evaluation design involves a mix of<br />
qualitative and quantitative data collection and analysis methods, such as surveys, open-ended<br />
response questions and one-on-one interviews. Each evaluation design involves the triangulation of<br />
multiple sources of data brought to bear on crucial evaluation questions.<br />
EVALUATION OBJECTIVES<br />
The design of this evaluation examines the program objectives, which are: to increase academic<br />
achievement and engagement in learning, to provide a safe space after school, and to provide under<br />
achieving students exposure to extra curricular opportunities.<br />
Using these objectives as the guide, the evaluation is designed to address the following sets of<br />
questions:<br />
1) What evidence is there to suggest that after school programs are having an impact on<br />
target student populations mathematic and language arts outcomes<br />
Do sites provide one-on-one or small group tutoring and homework assistance<br />
Do students have access to quality academic programming<br />
Do programs have a positive impact on student learning outcomes in language arts<br />
and math<br />
2) Do sites create a safe learning environment for students<br />
Do students have positive relationships with adults<br />
Do students have positive relationships with one another<br />
Are students provided with appropriate supervision<br />
Do students have access to healthy food choices<br />
3) Do students get to engage in a variety of activities that account for the various cultural,<br />
language, and learning style differences<br />
<strong>Targeted</strong> Students <strong>After</strong> <strong>School</strong> Programs 6
DATA COLLECTION METHODS<br />
To assess the success of the implementation and impact of the <strong>Targeted</strong> Students <strong>After</strong> <strong>School</strong> Programs<br />
four data collection methods were used: (1) Site Observations and Monthly Meetings, (2) Document<br />
Review, (3) Mid-Year/End-of-Year Surveys and (4) Changes in GPA and CST scores based student<br />
HO#s.<br />
<br />
Site Observations & Monthly Meetings<br />
The program evaluator visited all program sites to observe students at the sites and gauge the<br />
appropriateness of site activities. In addition, program coordinators usually met with their<br />
staff/mentors and site coordinators about once a month. The program evaluator also attended these<br />
meeting to learn about the progress programs were making toward their goals and challenges they<br />
were facing.<br />
<br />
Review of Program Documents<br />
Program documents were reviewed to gain an understanding of the preparation program staff<br />
received, to keep a record of activities that students and families were invited to attend, to<br />
understand site coordinator reflections on the development of their students, and to keep track of<br />
attendance. Documents reviewed included staff contracts and handbook, books from the book<br />
group, monthly student rosters, monthly site reports, meeting agendas, large event agendas, and<br />
program advertisements.<br />
<br />
Mid-Year & End-of-Year Surveys<br />
Surveys were administered by program coordinators to students and families after large programs or<br />
events. The survey design was a short satisfaction survey to collect parent and student feedback to<br />
improve programming. The coordinator allowed the program evaluator to examine these surveys<br />
which are the basis for the formative and summative evaluation of the program.<br />
<br />
CST & GPA<br />
Each student participating in the <strong>Targeted</strong> Students <strong>After</strong> <strong>School</strong> Programs is provided a student ID<br />
number from the district called an HO Number. This number allows the program evaluator to track<br />
the students’ progress on formative and summative assessments as they are used by the school<br />
district. Using district databases and the student HO Number, the program evaluator will be able to<br />
track any possible impact of programming on student GPA for students in 6 th grade of higher and<br />
CST for 2 nd grade or higher.<br />
DATA ANALYSIS<br />
Each aspect of the evaluation design provides information for triangulation. Interviews allow the<br />
program evaluator to understand how teachers and schools were using the program, student and<br />
teacher involvement in the programs, and the alignment of the contracted services to the delivery of<br />
services. Qualitative data are used to gather a summative view of student performance after the<br />
service intervention. All quantitative analyses were performed on SPSS 18.0.<br />
<strong>Targeted</strong> Students <strong>After</strong> <strong>School</strong> Programs 7
EVALUATION FINDINGS<br />
This section of the report is organized around the findings of the <strong>Targeted</strong> Students <strong>After</strong> <strong>School</strong><br />
Programs evaluation. Guided by the following questions: 1) What evidence is there to suggest that<br />
after school programs are having an impact on targeted student populations mathematics and<br />
language arts outcomes, 2) Do sites create a safe learning environment for students, 3) Do students<br />
get to engage in a variety of activities that account for the various cultural, language, and learning<br />
style differences.<br />
QUANTITATIVE FINDINGS<br />
Population<br />
The <strong>Targeted</strong> Students <strong>After</strong> <strong>School</strong> Programs serve students primarily from the Bayview Hunters<br />
Point, Western Addition, Chinatown, and Ingleside areas although all SFUSD students are<br />
welcomed to attend. Students in the programs are quite diverse and represent all backgrounds. The<br />
primary populations served by these programs are African American, Latino, and Chinese. All<br />
grades are served by the programs as well.<br />
ETHNICITY <strong>2009</strong>-<strong>10</strong><br />
Count Percent<br />
American Indian 2 .8%<br />
Arabic 1 .4%<br />
Black 79 33.3%<br />
Chinese 90 38.0%<br />
Decline to State 7 3.0%<br />
Filipino 8 3.4%<br />
Japanese 1 .4%<br />
Korean 1 .4%<br />
Other Non-White <strong>10</strong> 4.2%<br />
Other White 2 .8%<br />
Samoan 4 1.7%<br />
Spanish Surname 32 13.5%<br />
Total 237 <strong>10</strong>0.0%<br />
GRADE <strong>2009</strong>-<strong>10</strong><br />
Count Percent<br />
K 24 <strong>10</strong>.1%<br />
1 28 11.8%<br />
2 35 14.8%<br />
3 34 14.3%<br />
4 22 9.3%<br />
5 26 11.0%<br />
6 18 7.6%<br />
7 11 4.6%<br />
8 9 3.8%<br />
9 13 5.5%<br />
<strong>10</strong> 5 2.1%<br />
11 3 1.3%<br />
12 9 3.8%<br />
Total 237 <strong>10</strong>0.0%<br />
<strong>Targeted</strong> Students <strong>After</strong> <strong>School</strong> Programs 8
<strong>Targeted</strong> Students <strong>After</strong> <strong>School</strong> Program participants generally fit within the highest needs groups of<br />
students affected by the achievement gap in <strong>San</strong> <strong>Francisco</strong> Unified. These students qualify for free<br />
or reduced lunch at rates that do not match the district. They also have English Language<br />
difficulties.<br />
LANGUAGE FLUENCY <strong>2009</strong>-<strong>10</strong><br />
Count Percent<br />
English <strong>10</strong>3 43.5%<br />
Fluent 13 5.5%<br />
Limited English 98 41.4%<br />
Reclassified/ 23 9.7%<br />
Redesignated<br />
Total 237 <strong>10</strong>0.0%<br />
SOCIOECONOMIC <strong>2009</strong>-<strong>10</strong><br />
Count Percent<br />
No 28 11.8%<br />
Yes 209 88.2%<br />
Total 237 <strong>10</strong>0.0<br />
California Standards Tests<br />
Approximately 237 students were served by the <strong>Targeted</strong> Students <strong>After</strong> <strong>School</strong> Programs during<br />
the <strong>2009</strong>-<strong>10</strong> school year, because many of these students are in elementary grades they will not have<br />
GPA scores because standards based report cards are used. In lieu of GPA changes in student<br />
proficiency on the CST for English Language Arts and Math will be used.<br />
Matched English Language Arts test scores were available for 112 students who participated in the<br />
Consent decree programs. The pivot table chart and table below state that 20% of students gained at<br />
least one proficiency level, 61% remained the same, and 18% of students decreased at least one<br />
proficiency level.<br />
<strong>Targeted</strong> Students <strong>After</strong> <strong>School</strong> Programs 9
Far Below Basic<br />
Below Basic<br />
Basic<br />
Proficient<br />
Advanced<br />
Total Students:<br />
-4 -3 -2 -1 0 1 2 3 4 Total<br />
0<br />
0%<br />
0<br />
0%<br />
0<br />
0%<br />
0<br />
0%<br />
0<br />
0%<br />
2<br />
40%<br />
2<br />
40%<br />
1<br />
20%<br />
5<br />
4%<br />
4<br />
25%<br />
4<br />
25%<br />
6<br />
38%<br />
2<br />
13%<br />
16<br />
14%<br />
8<br />
12%<br />
<strong>10</strong><br />
15%<br />
22<br />
32%<br />
14<br />
21%<br />
14<br />
21%<br />
68<br />
61%<br />
2<br />
11%<br />
3<br />
17%<br />
<strong>10</strong><br />
56%<br />
3<br />
17%<br />
18<br />
16%<br />
3<br />
60%<br />
0<br />
0%<br />
2<br />
40%<br />
5<br />
4%<br />
0<br />
0%<br />
0<br />
0%<br />
0<br />
0%<br />
0<br />
0%<br />
0<br />
0%<br />
13<br />
12%<br />
17<br />
15%<br />
40<br />
36%<br />
25<br />
22%<br />
17<br />
15%<br />
112<br />
<strong>10</strong>0%<br />
Matched Mathematics test scores are available for 113 students who participated in the Consent<br />
decree programs. The pivot table chart and table below state that 22% of students gained at least<br />
one proficiency level, 51% remained the same, and 26% of students decreased at least one<br />
proficiency level.<br />
<strong>Targeted</strong> Students <strong>After</strong> <strong>School</strong> Programs <strong>10</strong>
Far Below Basic<br />
Below Basic<br />
Basic<br />
Proficient<br />
Advanced<br />
Total Students:<br />
-4 -3 -2 -1 0 1 2 3 4 Total<br />
0<br />
0%<br />
0<br />
0%<br />
0<br />
0%<br />
0<br />
0%<br />
0<br />
0%<br />
3<br />
43%<br />
3<br />
43%<br />
1<br />
14%<br />
7<br />
6%<br />
4<br />
17%<br />
7<br />
30%<br />
6<br />
26%<br />
6<br />
26%<br />
23<br />
20%<br />
5<br />
9%<br />
<strong>10</strong><br />
17%<br />
11<br />
19%<br />
7<br />
12%<br />
25<br />
43%<br />
58<br />
51%<br />
6<br />
32%<br />
4<br />
21%<br />
2<br />
11%<br />
7<br />
37%<br />
19<br />
17%<br />
1<br />
17%<br />
3<br />
50%<br />
2<br />
33%<br />
6<br />
5%<br />
0<br />
0%<br />
0<br />
0%<br />
0<br />
0%<br />
0<br />
0%<br />
0<br />
0%<br />
12<br />
11%<br />
21<br />
19%<br />
25<br />
22%<br />
23<br />
20%<br />
32<br />
28%<br />
113<br />
<strong>10</strong>0%<br />
Results suggest that students in <strong>Targeted</strong> Students <strong>After</strong> <strong>School</strong> Programs are maintaining well and<br />
making gains in English Language Arts. They are falling slightly behind in Mathematics.<br />
Grade Point Average<br />
Grade Point Average, GPA, is available for middle and high school students who participated in the<br />
Consent Decree Programs. The average mean of these students increased from the 2008-09 to the<br />
<strong>2009</strong>-<strong>10</strong> school year. Below you will find the breakdown of GPA by ethnicity and grade level.<br />
GPA BY ETHNICITY<br />
ETHNICITY<br />
GPA<br />
<strong>2009</strong><br />
GPA<br />
20<strong>10</strong><br />
Arabic Mean .4000 .3300<br />
N 1 1<br />
Std. Deviation . .<br />
Black Mean 1.8379 1.9066<br />
N 28 32<br />
Std. Deviation .92937 1.11839<br />
Chinese Mean 3.2400 3.0600<br />
N 7 14<br />
Std. Deviation .90239 .93936<br />
Decline to Mean .4000 2.6450<br />
State N 1 2<br />
Std. Deviation . .34648<br />
Filipino Mean 1.4000<br />
N 2<br />
Std. Deviation .28284<br />
Korean Mean 3.8000 2.9000<br />
N 1 1<br />
Std. Deviation . .<br />
Other Non- Mean 3.0900 2.6000<br />
White N 3 3<br />
Std. Deviation .64211 .91652<br />
Other White Mean 3.3300 3.6700<br />
N 1 1<br />
Std. Deviation . .<br />
Samoan Mean 2.4650 2.9200<br />
N 2 2<br />
Std. Deviation .19092 .35355<br />
Spanish Mean .6000 1.9143<br />
Surname N 2 7<br />
Std. Deviation .00000 1.12462<br />
Total Mean 2.1189 2.2443<br />
N 46 65<br />
Std. Deviation 1.13492 1.13698<br />
<strong>Targeted</strong> Students <strong>After</strong> <strong>School</strong> Programs 11
GPA BY GRADE LEVEL<br />
GRADE GPA09 GPA<strong>10</strong><br />
6 Mean 2.5050<br />
N 18<br />
Std. Deviation 1.00122<br />
7 Mean 1.6400 1.8256<br />
N <strong>10</strong> 9<br />
Std. Deviation 1.02328 1.14919<br />
8 Mean 2.2750 2.0589<br />
N 8 9<br />
Std. Deviation 1.35198 1.21438<br />
9 Mean 1.8492 1.4683<br />
N 12 12<br />
Std. Deviation 1.13254 1.05267<br />
<strong>10</strong> Mean 2.6775 2.7460<br />
N 4 5<br />
Std. Deviation 1.30742 1.46683<br />
11 Mean 2.4900 2.9900<br />
N 3 3<br />
Std. Deviation 1.05228 .53675<br />
12 Mean 2.5000 2.8344<br />
N 9 9<br />
Std. Deviation .99760 .83367<br />
Total Mean 2.1189 2.2443<br />
N 46 65<br />
Std. Deviation 1.13492 1.13698<br />
GPA for students in the target population served by the <strong>Targeted</strong> Students <strong>After</strong> <strong>School</strong> Programs<br />
increased. African Americans, Samoans, and Latinos all saw increases in their GPA means. African<br />
American and Samoan high schools students have higher GPAs than those of their district<br />
counterparts.<br />
QUALITATIVE FINDINGS<br />
Based on site observations, monthly meetings, and monthly report reviews, ample qualitative data<br />
was available about the role community-based after school programs played for their students. All<br />
sites provided tutoring or provided access to tutoring based on their mission. Students in the<br />
Citywide Tutorial Program and at the Ingleside Community Center had additional access to a math<br />
tutor and a reading specialist that came to sites twice a week. Citywide Tutorial sites also had access<br />
to Xtra Weekly, an online language arts complementary program that site coordinators were required<br />
to use with students to increase language arts exposure.<br />
All sites were observed to have appropriate supervision of students and provided safe spaces for<br />
them. Smaller sites such as Providence, Ping Yuen, and Tindley usually had the site coordinator,<br />
tutorial staff, and volunteers while larger sites like Ingleside and Ella Hill Hutch had security on site<br />
in addition to program staff. Students had access to many adults and teachers for tutoring and<br />
mentoring. At several programs mentors and tutors attracted a small group of students with whom<br />
they connected. All sites provided students with a snack after school and Ingleside Community<br />
Center and the <strong>San</strong> <strong>Francisco</strong> Christian Center provided students with hot meals several days a week<br />
after school. Snacks generally included a piece of fruit and a granola bar or animal crackers.<br />
Based on the differences in the programs, students were engaged in a variety of activities at after<br />
school programs. The Tindley Music Academy offers piano lessons to its after school students. The<br />
<strong>San</strong> <strong>Francisco</strong> Christian Center has sports and a girls group available to students. Ingleside and Ella<br />
<strong>Targeted</strong> Students <strong>After</strong> <strong>School</strong> Programs 12
Hill Hutch have basketball and dance available to students. Ingleside, for example, took students to<br />
a working farm and on an overnight camping trip during the year. Students had access to non<br />
competitive activities such as bowling, modeling, and recreational sports as well as the arts through<br />
museums and music.<br />
The benefits of community-based after school programming are evident from two incidents that<br />
occurred in the <strong>2009</strong>-<strong>10</strong> year where the after school program was able to intervene where schools<br />
did not. In one case, two students, a brother and sister, became homeless right before Christmas.<br />
The situation was complicated by the fact that the sister was near eighteen years old and then would<br />
be considered an adult. The Providence Opportunity Program staff and mentors worked within the<br />
community and church base to find a family shelter that would take both the brother and sister and<br />
not separate them nor make the sister leave once she turned eighteen. This allowed the sister to care<br />
for her brother and have a place to stay until she could graduate from high school in June. The sister<br />
was on track to go to college and the Providence staff was working with her to create a plan for the<br />
brother so that the sister did not defer college enrollment to take care of her brother.<br />
In another incident Citywide Tutorial staff intervened on behalf of an immigrant family that was not<br />
receiving appropriate services. Tutorial staff at one Citywide after school site noticed that a student<br />
did not seem to be making appropriate progress on her school work. The site raised this issue at a<br />
monthly meeting and referred it to the program evaluator and Special Assistant to the<br />
Superintendent for review. It was determined based on CELDT data and report card data that the<br />
student was making no progress at all and had not since she entered the district in kindergarten. All<br />
parties involved were concerned that the student had been passed along and never tested for special<br />
service needs. Based on the tutorial staff discovery, a meeting occurred between the Citywide<br />
Tutorial program director, the Special Assistant to the Superintendent, and the school principal to<br />
develop a shared plan for the student as she entered sixth grade.<br />
LIMITATIONS OF THE DATA<br />
Because of the nature of afterschool program, the best indicators of their success are more<br />
qualitative than quantitative. <strong>After</strong> school programs are designed for safety, enrichment, and<br />
homework assistance. In so far as, homework completion impacts GPA and readiness for the CST,<br />
these indicators are fine measures of student progress. However, caution is recommended when<br />
examining these quantitative factors alone as both are more highly impacted by teacher instruction.<br />
COST ANALYSIS<br />
The <strong>Targeted</strong> Students <strong>After</strong> <strong>School</strong> Programs each have separate contracts and separate student<br />
populations. Each contract is listed separately below. The total cost of the contracts was $195,000.<br />
The following is the cost per student based on the number of students served:<br />
Citywide Tutorial Program $<strong>10</strong>0,000<br />
Ella Hill Hutch Community Center $45,000<br />
Ingleside Community Center $25,000<br />
Providence Opportunity Program $25,000<br />
Total Number of Students Served 237<br />
Total Cost Per Student $822.78<br />
<strong>Targeted</strong> Students <strong>After</strong> <strong>School</strong> Programs 13
ISSUES TO CONSIDER FOR CONTINUAL IMPROVEMENT<br />
Process Recommendations<br />
<br />
<br />
Program Coordinators should make more efforts to connect with underserved<br />
populations across the district. Although African American and Latino students compose<br />
a significant portion of the <strong>Targeted</strong> Students <strong>After</strong> <strong>School</strong> Programs numbers have been<br />
steadily decreasing as part of the total population. This may be because of the decrease of<br />
minorities in the SFUSD.<br />
Program Coordinators should make more efforts to connect with middle and high<br />
school students across the district. <strong>Targeted</strong> Students <strong>After</strong> <strong>School</strong> Programs serve all<br />
grades but the number of high school students drops significantly. However, at risk high<br />
school students seem to benefit greatly from involvement in these programs.<br />
<strong>Evaluation</strong> Recommendations<br />
<br />
Program Directors should make more efforts to connect site coordinators and get<br />
rosters that provide student attendance and dosage. Although all site collect student<br />
attendance. Program <strong>Evaluation</strong> and Research still has difficulty getting dosage from all site<br />
coordinators. The number of hours or days served would assist with the quality of the<br />
evaluation.<br />
<strong>Targeted</strong> Students <strong>After</strong> <strong>School</strong> Programs 14
REFERENCES<br />
<strong>After</strong>school Alliance. (<strong>2009</strong>) America <strong>After</strong> 3 PM A Household Survey on <strong>After</strong>school in America.<br />
JC Penney <strong>After</strong>school Fund. http://www.afterschoolalliance.org/AA3PM.cfm<br />
Cousins, Bradley J. & Earl, Lorna N. (1992). <strong>Evaluation</strong> in education: Studies in <strong>Evaluation</strong> use and<br />
organizational learning. The Falmer Press Teachers’ Library.<br />
Fetterman, D.M.; Kaftarian, S.J. & Wandersman, A. (1996). Empowerment evaluation: Knowledge<br />
and tools for self-assessment and accountability. Thousand Oaks, CA: Sage Publications.<br />
Grossman, J., Campbell, M., and Raley, B. (2007). Quality Time <strong>After</strong>-<strong>School</strong>: What Instructors Can Do To<br />
Enhance Learning. Philadelphia: Public Private Ventures<br />
http://www.ppv.org/ppv/publications/assets/213_publication.pdf<br />
Harvard Family Research Project. (2008) <strong>After</strong> <strong>School</strong> Programs in the 21 st Century. Issues and<br />
Opportunities in Out-Of-<strong>School</strong> Time <strong>Evaluation</strong> <strong>10</strong>: 1-12<br />
http://www.hfrp.org/content/download/2916/84011/file/OSTissuebrief<strong>10</strong>.pdf<br />
Kakli, Z., Kreider, H., and Little, P. (2006) Focus on Families! How to build and support family-centered<br />
practices in afterschool. Cambridge: Harvard Family Research Project<br />
http://www.hfrp.org/content/download/<strong>10</strong>75/48578/file/focus_on_families.pdf<br />
Patton, M.Q. (1986). Utilization-Focused <strong>Evaluation</strong>. Newbury Park, CA: Sage Publications, Inc., p. 688.<br />
Patton, M.Q. (1994). Developmental evaluation. <strong>Evaluation</strong> Practice 15(3), 311 - 319.<br />
Patton, M.Q. (1997). Utilization-focused evaluation: The new century text. Edition 3. Thousand Oaks, CA:<br />
Sage Publications.<br />
American Youth Policy Forum. (2006). Helping youth succeed through out-of-school time programs.<br />
Washington, DC: http://www.aypf.org/publications/HelpingYouthOST2006.pdf<br />
<strong>Targeted</strong> Students <strong>After</strong> <strong>School</strong> Programs 15
APPENDIX<br />
<strong>Targeted</strong> Students <strong>After</strong> <strong>School</strong> Programs 16


