Tourism Satellite Account for South Africa 2006 to 2009
Tourism Satellite Account for South Africa 2006 to 2009
Tourism Satellite Account for South Africa 2006 to 2009

You also want an ePaper? Increase the reach of your titles
YUMPU automatically turns print PDFs into web optimized ePapers that Google loves.
Statistics <strong>South</strong> <strong>Africa</strong><br />
96<br />
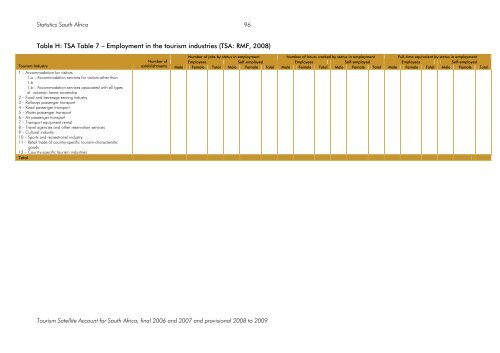
Table H: TSA Table 7 – Employment in the <strong>to</strong>urism industries (TSA: RMF, 2008)<br />
<strong>Tourism</strong> Industry<br />
1 – Accommodation <strong>for</strong> visi<strong>to</strong>rs<br />
1.a – Accommodation services <strong>for</strong> visi<strong>to</strong>rs other than<br />
1.b<br />
1.b – Accommodation services associated with all types<br />
of vacation home ownership<br />
2 – Food and beverage serving industry<br />
3 – Railways passenger transport<br />
4 – Road passenger transport<br />
5 – Water passenger transport<br />
6 – Air passenger transport<br />
7 – Transport equipment rental<br />
8 – Travel agencies and other reservation services<br />
9 – Cultural industry<br />
10 – Sports and recreational industry<br />
11 – Retail trade of country-specific <strong>to</strong>urism-characteristic<br />
goods<br />
12 – Country-specific <strong>to</strong>urism industries<br />
Total<br />
Number of jobs by status in employment Number of hours worked by status in employment Full-time equivalent by status in employment<br />
Number of<br />
Employees Self-employed Employees Self-employed Employees Self-employed<br />
establishments Male Female Total Male Female Total Male Female Total Male Female Total Male Female Total Male Female Total<br />
<strong>Tourism</strong> <strong>Satellite</strong> <strong>Account</strong> <strong>for</strong> <strong>South</strong> <strong>Africa</strong>, final <strong>2006</strong> and 2007 and provisional 2008 <strong>to</strong> <strong>2009</strong>