Tourism Satellite Account for South Africa 2006 to 2009
Tourism Satellite Account for South Africa 2006 to 2009
Tourism Satellite Account for South Africa 2006 to 2009

You also want an ePaper? Increase the reach of your titles
YUMPU automatically turns print PDFs into web optimized ePapers that Google loves.
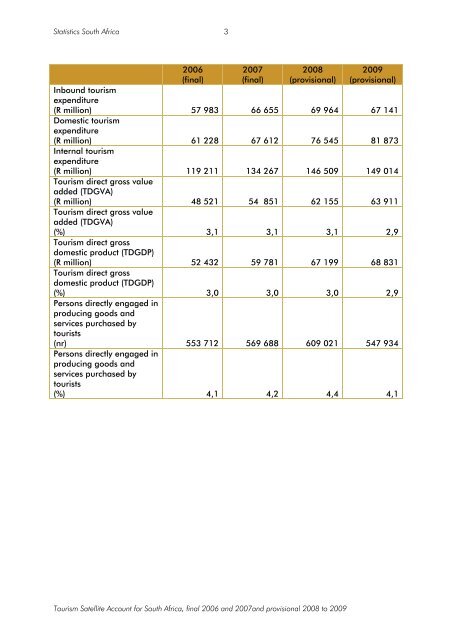
Statistics <strong>South</strong> <strong>Africa</strong><br />
3<br />
<strong>2006</strong><br />
(final)<br />
2007<br />
(final)<br />
2008<br />
(provisional)<br />
<strong>2009</strong><br />
(provisional)<br />
Inbound <strong>to</strong>urism<br />
expenditure<br />
(R million) 57 983 66 655 69 964 67 141<br />
Domestic <strong>to</strong>urism<br />
expenditure<br />
(R million) 61 228 67 612 76 545 81 873<br />
Internal <strong>to</strong>urism<br />
expenditure<br />
(R million) 119 211 134 267 146 509 149 014<br />
<strong>Tourism</strong> direct gross value<br />
added (TDGVA)<br />
(R million) 48 521 54 851 62 155 63 911<br />
<strong>Tourism</strong> direct gross value<br />
added (TDGVA)<br />
(%) 3,1 3,1 3,1 2,9<br />
<strong>Tourism</strong> direct gross<br />
domestic product (TDGDP)<br />
(R million) 52 432 59 781 67 199 68 831<br />
<strong>Tourism</strong> direct gross<br />
domestic product (TDGDP)<br />
(%) 3,0 3,0 3,0 2,9<br />
Persons directly engaged in<br />
producing goods and<br />
services purchased by<br />
<strong>to</strong>urists<br />
(nr) 553 712 569 688 609 021 547 934<br />
Persons directly engaged in<br />
producing goods and<br />
services purchased by<br />
<strong>to</strong>urists<br />
(%) 4,1 4,2 4,4 4,1<br />
<strong>Tourism</strong> <strong>Satellite</strong> <strong>Account</strong> <strong>for</strong> <strong>South</strong> <strong>Africa</strong>, final <strong>2006</strong> and 2007and provisional 2008 <strong>to</strong> <strong>2009</strong>