Tourism Satellite Account for South Africa 2006 to 2009
Tourism Satellite Account for South Africa 2006 to 2009
Tourism Satellite Account for South Africa 2006 to 2009

You also want an ePaper? Increase the reach of your titles
YUMPU automatically turns print PDFs into web optimized ePapers that Google loves.
Statistics <strong>South</strong> <strong>Africa</strong><br />
18<br />
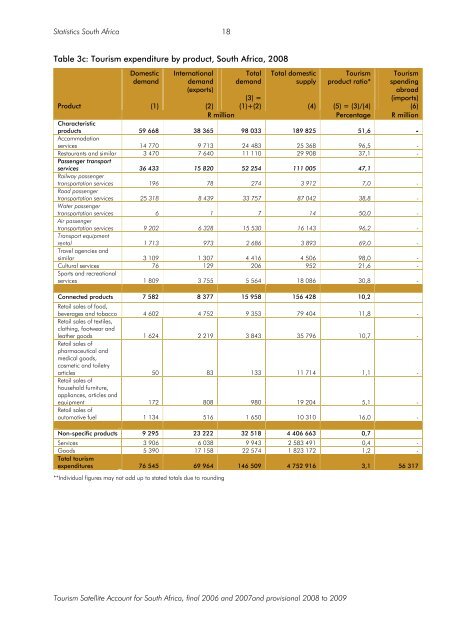
Table 3c: <strong>Tourism</strong> expenditure by product, <strong>South</strong> <strong>Africa</strong>, 2008<br />
Product<br />
Domestic<br />
demand<br />
(1)<br />
International<br />
demand<br />
(exports)<br />
(2)<br />
Total<br />
demand<br />
(3) =<br />
(1)+(2)<br />
Total domestic<br />
supply<br />
(4)<br />
<strong>Tourism</strong><br />
product ratio*<br />
(5) = (3)/(4)<br />
<strong>Tourism</strong><br />
spending<br />
abroad<br />
(imports)<br />
(6)<br />
R million Percentage R million<br />
Characteristic<br />
products 59 668 38 365 98 033 189 825 51,6 -<br />
Accommodation<br />
services 14 770 9 713 24 483 25 368 96,5 -<br />
Restaurants and similar 3 470 7 640 11 110 29 908 37,1 -<br />
Passenger transport<br />
services 36 433 15 820 52 254 111 005 47,1<br />
Railway passenger<br />
transportation services 196 78 274 3 912 7,0 -<br />
Road passenger<br />
transportation services 25 318 8 439 33 757 87 042 38,8 -<br />
Water passenger<br />
transportation services 6 1 7 14 50,0 -<br />
Air passenger<br />
transportation services 9 202 6 328 15 530 16 143 96,2 -<br />
Transport equipment<br />
rental 1 713 973 2 686 3 893 69,0 -<br />
Travel agencies and<br />
similar 3 109 1 307 4 416 4 506 98,0 -<br />
Cultural services 76 129 206 952 21,6 -<br />
Sports and recreational<br />
services 1 809 3 755 5 564 18 086 30,8 -<br />
Connected products 7 582 8 377 15 958 156 428 10,2<br />
Retail sales of food,<br />
beverages and <strong>to</strong>bacco 4 602 4 752 9 353 79 404 11,8 -<br />
Retail sales of textiles,<br />
clothing, footwear and<br />
leather goods 1 624 2 219 3 843 35 796 10,7 -<br />
Retail sales of<br />
pharmaceutical and<br />
medical goods,<br />
cosmetic and <strong>to</strong>iletry<br />
articles 50 83 133 11 714 1,1 -<br />
Retail sales of<br />
household furniture,<br />
appliances, articles and<br />
equipment 172 808 980 19 204 5,1 -<br />
Retail sales of<br />
au<strong>to</strong>motive fuel 1 134 516 1 650 10 310 16,0 -<br />
Non-specific products 9 295 23 222 32 518 4 406 663 0,7<br />
Services 3 906 6 038 9 943 2 583 491 0,4 -<br />
Goods 5 390 17 158 22 574 1 823 172 1,2 -<br />
Total <strong>to</strong>urism<br />
expenditures 76 545 69 964 146 509 4 752 916 3,1 56 317<br />
**Individual figures may not add up <strong>to</strong> stated <strong>to</strong>tals due <strong>to</strong> rounding<br />
<strong>Tourism</strong> <strong>Satellite</strong> <strong>Account</strong> <strong>for</strong> <strong>South</strong> <strong>Africa</strong>, final <strong>2006</strong> and 2007and provisional 2008 <strong>to</strong> <strong>2009</strong>