Tourism Satellite Account for South Africa 2006 to 2009
Tourism Satellite Account for South Africa 2006 to 2009
Tourism Satellite Account for South Africa 2006 to 2009

Create successful ePaper yourself
Turn your PDF publications into a flip-book with our unique Google optimized e-Paper software.
Statistics <strong>South</strong> <strong>Africa</strong><br />
26<br />
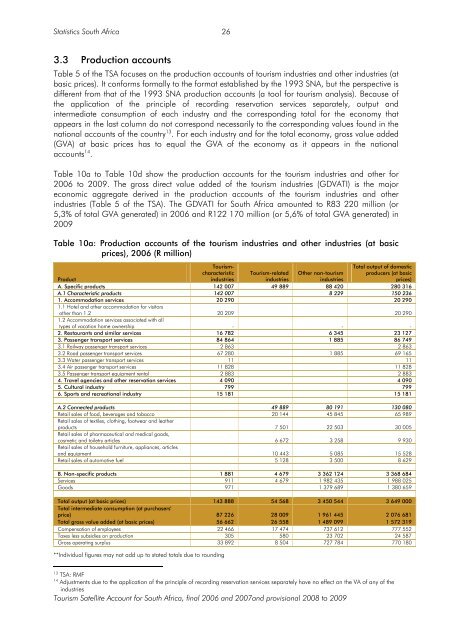
3.3 Production accounts<br />
Table 5 of the TSA focuses on the production accounts of <strong>to</strong>urism industries and other industries (at<br />
basic prices). It con<strong>for</strong>ms <strong>for</strong>mally <strong>to</strong> the <strong>for</strong>mat established by the 1993 SNA, but the perspective is<br />
different from that of the 1993 SNA production accounts (a <strong>to</strong>ol <strong>for</strong> <strong>to</strong>urism analysis). Because of<br />
the application of the principle of recording reservation services separately, output and<br />
intermediate consumption of each industry and the corresponding <strong>to</strong>tal <strong>for</strong> the economy that<br />
appears in the last column do not correspond necessarily <strong>to</strong> the corresponding values found in the<br />
national accounts of the country 13 . For each industry and <strong>for</strong> the <strong>to</strong>tal economy, gross value added<br />
(GVA) at basic prices has <strong>to</strong> equal the GVA of the economy as it appears in the national<br />
accounts 14 .<br />
Table 10a <strong>to</strong> Table 10d show the production accounts <strong>for</strong> the <strong>to</strong>urism industries and other <strong>for</strong><br />
<strong>2006</strong> <strong>to</strong> <strong>2009</strong>. The gross direct value added of the <strong>to</strong>urism industries (GDVATI) is the major<br />
economic aggregate derived in the production accounts of the <strong>to</strong>urism industries and other<br />
industries (Table 5 of the TSA). The GDVATI <strong>for</strong> <strong>South</strong> <strong>Africa</strong> amounted <strong>to</strong> R83 220 million (or<br />
5,3% of <strong>to</strong>tal GVA generated) in <strong>2006</strong> and R122 170 million (or 5,6% of <strong>to</strong>tal GVA generated) in<br />
<strong>2009</strong><br />
Table 10a: Production accounts of the <strong>to</strong>urism industries and other industries (at basic<br />
prices), <strong>2006</strong> (R million)<br />
<strong>Tourism</strong>characteristic<br />
industries<br />
Total output of domestic<br />
producers (at basic<br />
prices)<br />
<strong>Tourism</strong>-related Other non-<strong>to</strong>urism<br />
Product<br />
industries<br />
industries<br />
A. Specific products 142 007 49 889 88 420 280 316<br />
A.1 Characteristic products 142 007 8 229 150 236<br />
1. Accommodation services 20 290 20 290<br />
1.1 Hotel and other accommodation <strong>for</strong> visi<strong>to</strong>rs<br />
other than 1.2 20 209 20 290<br />
1.2 Accommodation services associated with all<br />
types of vacation home ownership - - -<br />
2. Restaurants and similar services 16 782 6 345 23 127<br />
3. Passenger transport services 84 864 1 885 86 749<br />
3.1 Railway passenger transport services 2 863 2 863<br />
3.2 Road passenger transport services 67 280 1 885 69 165<br />
3.3 Water passenger transport services 11 11<br />
3.4 Air passenger transport services 11 828 11 828<br />
3.5 Passenger transport equipment rental 2 883 2 883<br />
4. Travel agencies and other reservation services 4 090 4 090<br />
5. Cultural industry 799 799<br />
6. Sports and recreational industry 15 181 15 181<br />
A.2 Connected products 49 889 80 191 130 080<br />
Retail sales of food, beverages and <strong>to</strong>bacco 20 144 45 845 65 989<br />
Retail sales of textiles, clothing, footwear and leather<br />
products 7 501 22 503 30 005<br />
Retail sales of pharmaceutical and medical goods,<br />
cosmetic and <strong>to</strong>iletry articles 6 672 3 258 9 930<br />
Retail sales of household furniture, appliances, articles<br />
and equipment 10 443 5 085 15 528<br />
Retail sales of au<strong>to</strong>motive fuel 5 128 3 500 8 629<br />
B. Non-specific products 1 881 4 679 3 362 124 3 368 684<br />
Services 911 4 679 1 982 435 1 988 025<br />
Goods 971 1 379 689 1 380 659<br />
Total output (at basic prices) 143 888 54 568 3 450 544 3 649 000<br />
Total intermediate consumption (at purchasers'<br />
price) 87 226 28 009 1 961 445 2 076 681<br />
Total gross value added (at basic prices) 56 662 26 558 1 489 099 1 572 319<br />
Compensation of employees 22 466 17 474 737 612 777 552<br />
Taxes less subsidies on production 305 580 23 702 24 587<br />
Gross operating surplus 33 892 8 504 727 784 770 180<br />
**Individual figures may not add up <strong>to</strong> stated <strong>to</strong>tals due <strong>to</strong> rounding<br />
13<br />
TSA: RMF<br />
14<br />
Adjustments due <strong>to</strong> the application of the principle of recording reservation services separately have no effect on the VA of any of the<br />
industries<br />
<strong>Tourism</strong> <strong>Satellite</strong> <strong>Account</strong> <strong>for</strong> <strong>South</strong> <strong>Africa</strong>, final <strong>2006</strong> and 2007and provisional 2008 <strong>to</strong> <strong>2009</strong>