Tourism Satellite Account for South Africa 2006 to 2009
Tourism Satellite Account for South Africa 2006 to 2009
Tourism Satellite Account for South Africa 2006 to 2009

Create successful ePaper yourself
Turn your PDF publications into a flip-book with our unique Google optimized e-Paper software.
Statistics <strong>South</strong> <strong>Africa</strong><br />
35<br />
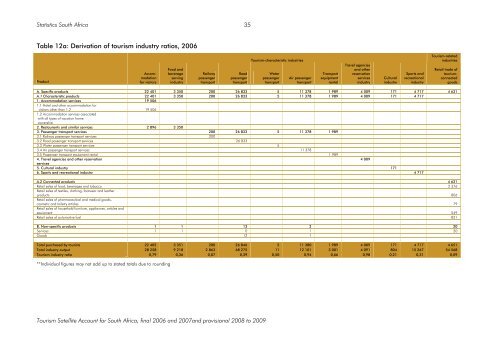
Table 12a: Derivation of <strong>to</strong>urism industry ratios, <strong>2006</strong><br />
Product<br />
Accommodation<br />
<strong>for</strong> visi<strong>to</strong>rs<br />
Food and<br />
beverage<br />
serving<br />
industry<br />
Railway<br />
passenger<br />
transport<br />
Road<br />
passenger<br />
transport<br />
<strong>Tourism</strong>-characteristic industries<br />
Water<br />
passenger<br />
transport<br />
Air passenger<br />
transport<br />
Transport<br />
equipment<br />
rental<br />
Travel agencies<br />
and other<br />
reservation<br />
services<br />
industry<br />
Cultural<br />
industry<br />
Sports and<br />
recreational<br />
industry<br />
<strong>Tourism</strong>-related<br />
industries<br />
Retail trade of<br />
<strong>to</strong>urismconnected<br />
goods<br />
A. Specific products 22 401 3 350 200 26 833 5 11 378 1 989 4 009 171 4 717 4 631<br />
A.1 Characteristic products 22 401 3 350 200 26 833 5 11 378 1 989 4 009 171 4 717<br />
1. Accommodation services 19 506<br />
1.1 Hotel and other accommodation <strong>for</strong><br />
visi<strong>to</strong>rs other than 1.2 19 506<br />
1.2 Accommodation services associated<br />
with all types of vacation home<br />
ownership<br />
2. Restaurants and similar services 2 896 3 350<br />
3. Passenger transport services 200 26 833 5 11 378 1 989<br />
3.1 Railway passenger transport services 200<br />
3.2 Road passenger transport services 26 833<br />
3.3 Water passenger transport services 5<br />
3.4 Air passenger transport services 11 378<br />
3.5 Passenger transport equipment rental 1 989<br />
4. Travel agencies and other reservation<br />
4 009<br />
services<br />
5. Cultural industry 171<br />
6. Sports and recreational industry 4 717<br />
A.2 Connected products 4 631<br />
Retail sales of food, beverages and <strong>to</strong>bacco 2 376<br />
Retail sales of textiles, clothing, footwear and leather<br />
products 806<br />
Retail sales of pharmaceutical and medical goods,<br />
cosmetic and <strong>to</strong>iletry articles 79<br />
Retail sales of household furniture, appliances, articles and<br />
equipment 549<br />
Retail sales of au<strong>to</strong>motive fuel 821<br />
B. Non-specific products 1 1 13 2 20<br />
Services 1 1 0 1 20<br />
Goods 12 1<br />
Total purchased by <strong>to</strong>urists 22 402 3 351 200 26 846 5 11 380 1 989 4 009 171 4 717 4 651<br />
Total industry output 28 258 9 218 2 863 68 275 11 12 101 3 001 4 091 804 15 267 54 568<br />
<strong>Tourism</strong> industry ratio 0,79 0,36 0,07 0,39 0,50 0,94 0,66 0,98 0,21 0,31 0,09<br />
**Individual figures may not add up <strong>to</strong> stated <strong>to</strong>tals due <strong>to</strong> rounding<br />
<strong>Tourism</strong> <strong>Satellite</strong> <strong>Account</strong> <strong>for</strong> <strong>South</strong> <strong>Africa</strong>, final <strong>2006</strong> and 2007and provisional 2008 <strong>to</strong> <strong>2009</strong>