Tourism Satellite Account for South Africa 2006 to 2009
Tourism Satellite Account for South Africa 2006 to 2009
Tourism Satellite Account for South Africa 2006 to 2009

Create successful ePaper yourself
Turn your PDF publications into a flip-book with our unique Google optimized e-Paper software.
Statistics <strong>South</strong> <strong>Africa</strong><br />
16<br />
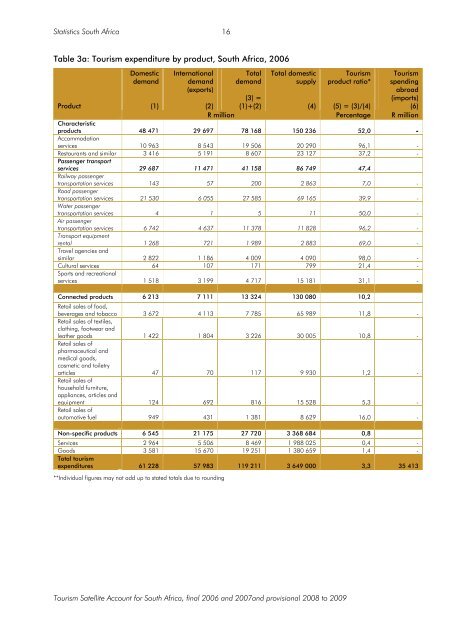
Table 3a: <strong>Tourism</strong> expenditure by product, <strong>South</strong> <strong>Africa</strong>, <strong>2006</strong><br />
Product<br />
Domestic<br />
demand<br />
(1)<br />
International<br />
demand<br />
(exports)<br />
(2)<br />
Total<br />
demand<br />
(3) =<br />
(1)+(2)<br />
Total domestic<br />
supply<br />
(4)<br />
<strong>Tourism</strong><br />
product ratio*<br />
(5) = (3)/(4)<br />
<strong>Tourism</strong><br />
spending<br />
abroad<br />
(imports)<br />
(6)<br />
R million Percentage R million<br />
Characteristic<br />
products 48 471 29 697 78 168 150 236 52,0 -<br />
Accommodation<br />
services 10 963 8 543 19 506 20 290 96,1 -<br />
Restaurants and similar 3 416 5 191 8 607 23 127 37,2 -<br />
Passenger transport<br />
services 29 687 11 471 41 158 86 749 47,4<br />
Railway passenger<br />
transportation services 143 57 200 2 863 7,0 -<br />
Road passenger<br />
transportation services 21 530 6 055 27 585 69 165 39,9 -<br />
Water passenger<br />
transportation services 4 1 5 11 50,0 -<br />
Air passenger<br />
transportation services 6 742 4 637 11 378 11 828 96,2 -<br />
Transport equipment<br />
rental 1 268 721 1 989 2 883 69,0 -<br />
Travel agencies and<br />
similar 2 822 1 186 4 009 4 090 98,0 -<br />
Cultural services 64 107 171 799 21,4 -<br />
Sports and recreational<br />
services 1 518 3 199 4 717 15 181 31,1 -<br />
Connected products 6 213 7 111 13 324 130 080 10,2<br />
Retail sales of food,<br />
beverages and <strong>to</strong>bacco 3 672 4 113 7 785 65 989 11,8 -<br />
Retail sales of textiles,<br />
clothing, footwear and<br />
leather goods 1 422 1 804 3 226 30 005 10,8 -<br />
Retail sales of<br />
pharmaceutical and<br />
medical goods,<br />
cosmetic and <strong>to</strong>iletry<br />
articles 47 70 117 9 930 1,2 -<br />
Retail sales of<br />
household furniture,<br />
appliances, articles and<br />
equipment 124 692 816 15 528 5,3 -<br />
Retail sales of<br />
au<strong>to</strong>motive fuel 949 431 1 381 8 629 16,0 -<br />
Non-specific products 6 545 21 175 27 720 3 368 684 0,8<br />
Services 2 964 5 506 8 469 1 988 025 0,4 -<br />
Goods 3 581 15 670 19 251 1 380 659 1,4 -<br />
Total <strong>to</strong>urism<br />
expenditures 61 228 57 983 119 211 3 649 000 3,3 35 413<br />
**Individual figures may not add up <strong>to</strong> stated <strong>to</strong>tals due <strong>to</strong> rounding<br />
<strong>Tourism</strong> <strong>Satellite</strong> <strong>Account</strong> <strong>for</strong> <strong>South</strong> <strong>Africa</strong>, final <strong>2006</strong> and 2007and provisional 2008 <strong>to</strong> <strong>2009</strong>