Tourism Satellite Account for South Africa 2006 to 2009
Tourism Satellite Account for South Africa 2006 to 2009
Tourism Satellite Account for South Africa 2006 to 2009

Create successful ePaper yourself
Turn your PDF publications into a flip-book with our unique Google optimized e-Paper software.
Statistics <strong>South</strong> <strong>Africa</strong><br />
45<br />
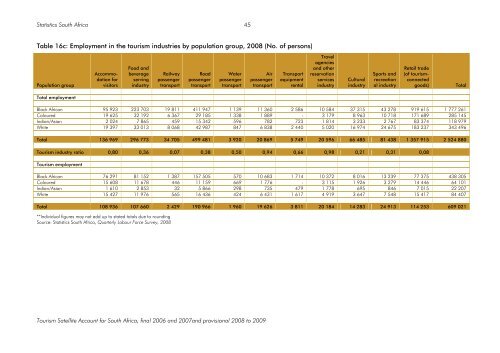
Table 16c: Employment in the <strong>to</strong>urism industries by population group, 2008 (No. of persons)<br />
Population group<br />
Accommodation<br />
<strong>for</strong><br />
visi<strong>to</strong>rs<br />
Food and<br />
beverage<br />
serving<br />
industry<br />
Railway<br />
passenger<br />
transport<br />
Road<br />
passenger<br />
transport<br />
Water<br />
passenger<br />
transport<br />
Air<br />
passenger<br />
transport<br />
Transport<br />
equipment<br />
rental<br />
Travel<br />
agencies<br />
and other<br />
reservation<br />
services<br />
industry<br />
Cultural<br />
industry<br />
Sports and<br />
recreation<br />
al industry<br />
Retail trade<br />
(of <strong>to</strong>urismconnected<br />
goods)<br />
Total<br />
Total employment<br />
Black <strong>Africa</strong>n 95 923 223 703 19 811 411 947 1 139 11 360 2 586 10 584 37 315 43 278 919 615 1 777 261<br />
Coloured 19 625 32 192 6 367 29 185 1 338 1 889 - 3 179 8 963 10 718 171 689 285 145<br />
Indian/Asian 2 024 7 865 459 15 342 596 782 723 1 814 3 233 2 767 83 374 118 979<br />
White 19 397 33 013 8 068 42 987 847 6 838 2 440 5 020 16 974 24 675 183 237 343 496<br />
Total 136 969 296 773 34 705 499 481 3 920 20 869 5 749 20 596 66 485 81 438 1 357 915 2 524 880<br />
<strong>Tourism</strong> industry ratio 0,80 0,36 0,07 0,38 0,50 0,94 0,66 0,98 0,21 0,31 0,08<br />
<strong>Tourism</strong> employment<br />
Black <strong>Africa</strong>n 76 291 81 152 1 387 157 505 570 10 683 1 714 10 372 8 016 13 239 77 375 438 305<br />
Coloured 15 608 11 678 446 11 159 669 1 776 - 3 115 1 926 3 279 14 446 64 101<br />
Indian/Asian 1 610 2 853 32 5 866 298 735 479 1 778 695 846 7 015 22 207<br />
White 15 427 11 976 565 16 436 424 6 431 1 617 4 919 3 647 7 548 15 417 84 407<br />
Total 108 936 107 660 2 429 190 966 1 960 19 626 3 811 20 184 14 283 24 913 114 253 609 021<br />
**Individual figures may not add up <strong>to</strong> stated <strong>to</strong>tals due <strong>to</strong> rounding<br />
Source: Statistics <strong>South</strong> <strong>Africa</strong>, Quarterly Labour Force Survey, 2008<br />
<strong>Tourism</strong> <strong>Satellite</strong> <strong>Account</strong> <strong>for</strong> <strong>South</strong> <strong>Africa</strong>, final <strong>2006</strong> and 2007and provisional 2008 <strong>to</strong> <strong>2009</strong>