Tourism Satellite Account for South Africa 2006 to 2009
Tourism Satellite Account for South Africa 2006 to 2009
Tourism Satellite Account for South Africa 2006 to 2009

Create successful ePaper yourself
Turn your PDF publications into a flip-book with our unique Google optimized e-Paper software.
Statistics <strong>South</strong> <strong>Africa</strong><br />
19<br />
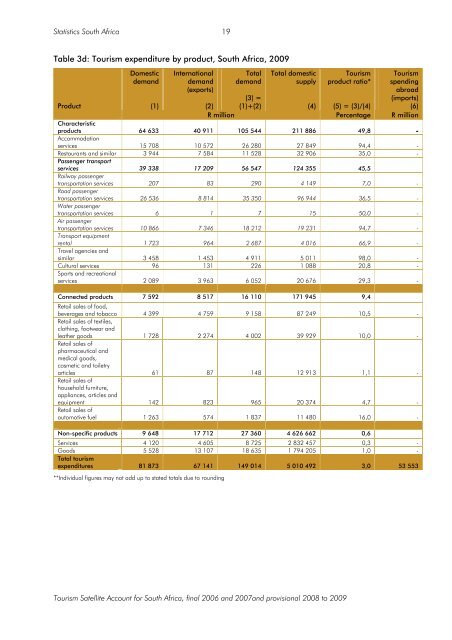
Table 3d: <strong>Tourism</strong> expenditure by product, <strong>South</strong> <strong>Africa</strong>, <strong>2009</strong><br />
Product<br />
Domestic<br />
demand<br />
(1)<br />
International<br />
demand<br />
(exports)<br />
(2)<br />
Total<br />
demand<br />
(3) =<br />
(1)+(2)<br />
Total domestic<br />
supply<br />
(4)<br />
<strong>Tourism</strong><br />
product ratio*<br />
(5) = (3)/(4)<br />
<strong>Tourism</strong><br />
spending<br />
abroad<br />
(imports)<br />
(6)<br />
R million Percentage R million<br />
Characteristic<br />
products 64 633 40 911 105 544 211 886 49,8 -<br />
Accommodation<br />
services 15 708 10 572 26 280 27 849 94,4 -<br />
Restaurants and similar 3 944 7 584 11 528 32 906 35,0 -<br />
Passenger transport<br />
services 39 338 17 209 56 547 124 355 45,5<br />
Railway passenger<br />
transportation services 207 83 290 4 149 7,0 -<br />
Road passenger<br />
transportation services 26 536 8 814 35 350 96 944 36,5 -<br />
Water passenger<br />
transportation services 6 1 7 15 50,0 -<br />
Air passenger<br />
transportation services 10 866 7 346 18 212 19 231 94,7 -<br />
Transport equipment<br />
rental 1 723 964 2 687 4 016 66,9 -<br />
Travel agencies and<br />
similar 3 458 1 453 4 911 5 011 98,0 -<br />
Cultural services 96 131 226 1 088 20,8 -<br />
Sports and recreational<br />
services 2 089 3 963 6 052 20 676 29,3 -<br />
Connected products 7 592 8 517 16 110 171 945 9,4<br />
Retail sales of food,<br />
beverages and <strong>to</strong>bacco 4 399 4 759 9 158 87 249 10,5 -<br />
Retail sales of textiles,<br />
clothing, footwear and<br />
leather goods 1 728 2 274 4 002 39 929 10,0 -<br />
Retail sales of<br />
pharmaceutical and<br />
medical goods,<br />
cosmetic and <strong>to</strong>iletry<br />
articles 61 87 148 12 913 1,1 -<br />
Retail sales of<br />
household furniture,<br />
appliances, articles and<br />
equipment 142 823 965 20 374 4,7 -<br />
Retail sales of<br />
au<strong>to</strong>motive fuel 1 263 574 1 837 11 480 16,0 -<br />
Non-specific products 9 648 17 712 27 360 4 626 662 0,6<br />
Services 4 120 4 605 8 725 2 832 457 0,3 -<br />
Goods 5 528 13 107 18 635 1 794 205 1,0 -<br />
Total <strong>to</strong>urism<br />
expenditures 81 873 67 141 149 014 5 010 492 3,0 53 553<br />
**Individual figures may not add up <strong>to</strong> stated <strong>to</strong>tals due <strong>to</strong> rounding<br />
<strong>Tourism</strong> <strong>Satellite</strong> <strong>Account</strong> <strong>for</strong> <strong>South</strong> <strong>Africa</strong>, final <strong>2006</strong> and 2007and provisional 2008 <strong>to</strong> <strong>2009</strong>