Tourism Satellite Account for South Africa 2006 to 2009
Tourism Satellite Account for South Africa 2006 to 2009
Tourism Satellite Account for South Africa 2006 to 2009

Create successful ePaper yourself
Turn your PDF publications into a flip-book with our unique Google optimized e-Paper software.
Statistics <strong>South</strong> <strong>Africa</strong><br />
43<br />
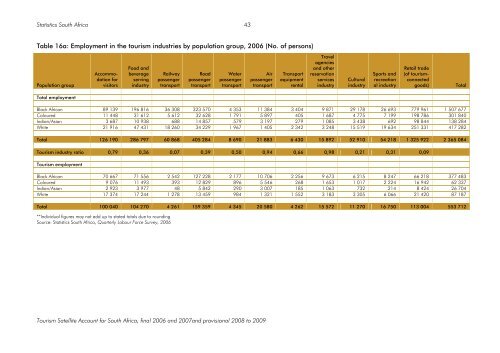
Table 16a: Employment in the <strong>to</strong>urism industries by population group, <strong>2006</strong> (No. of persons)<br />
Population group<br />
Accommodation<br />
<strong>for</strong><br />
visi<strong>to</strong>rs<br />
Food and<br />
beverage<br />
serving<br />
industry<br />
Railway<br />
passenger<br />
transport<br />
Road<br />
passenger<br />
transport<br />
Water<br />
passenger<br />
transport<br />
Air<br />
passenger<br />
transport<br />
Transport<br />
equipment<br />
rental<br />
Travel<br />
agencies<br />
and other<br />
reservation<br />
services<br />
industry<br />
Cultural<br />
industry<br />
Sports and<br />
recreation<br />
al industry<br />
Retail trade<br />
(of <strong>to</strong>urismconnected<br />
goods)<br />
Total<br />
Total employment<br />
Black <strong>Africa</strong>n 89 139 196 816 36 308 323 570 4 353 11 384 3 404 9 871 29 178 26 693 779 961 1 507 677<br />
Coloured 11 448 31 612 5 612 32 628 1 791 5 897 405 1 687 4 775 7 199 198 786 301 840<br />
Indian/Asian 3 687 10 938 688 14 857 579 3 197 279 1 085 3 438 692 98 844 138 284<br />
White 21 916 47 431 18 260 34 229 1 967 1 405 2 342 3 248 15 519 19 634 251 331 417 282<br />
Total 126 190 286 797 60 868 405 284 8 690 21 883 6 430 15 892 52 910 54 218 1 325 922 2 365 084<br />
<strong>Tourism</strong> industry ratio 0,79 0,36 0,07 0,39 0,50 0,94 0,66 0,98 0,21 0,31 0,09<br />
<strong>Tourism</strong> employment<br />
Black <strong>Africa</strong>n 70 667 71 556 2 542 127 228 2 177 10 706 2 256 9 673 6 215 8 247 66 218 377 483<br />
Coloured 9 076 11 493 393 12 829 896 5 546 268 1 653 1 017 2 224 16 942 62 337<br />
Indian/Asian 2 923 3 977 48 5 842 290 3 007 185 1 063 732 214 8 424 26 704<br />
White 17 374 17 244 1 278 13 459 984 1 321 1 552 3 183 3 305 6 066 21 420 87 187<br />
Total 100 040 104 270 4 261 159 359 4 345 20 580 4 262 15 572 11 270 16 750 113 004 553 712<br />
**Individual figures may not add up <strong>to</strong> stated <strong>to</strong>tals due <strong>to</strong> rounding<br />
Source: Statistics <strong>South</strong> <strong>Africa</strong>, Quarterly Labour Force Survey, <strong>2006</strong><br />
<strong>Tourism</strong> <strong>Satellite</strong> <strong>Account</strong> <strong>for</strong> <strong>South</strong> <strong>Africa</strong>, final <strong>2006</strong> and 2007and provisional 2008 <strong>to</strong> <strong>2009</strong>