Tourism Satellite Account for South Africa 2006 to 2009
Tourism Satellite Account for South Africa 2006 to 2009
Tourism Satellite Account for South Africa 2006 to 2009

Create successful ePaper yourself
Turn your PDF publications into a flip-book with our unique Google optimized e-Paper software.
Statistics <strong>South</strong> <strong>Africa</strong><br />
34<br />
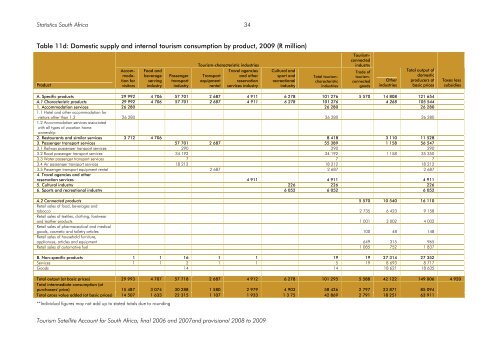
Table 11d: Domestic supply and internal <strong>to</strong>urism consumption by product, <strong>2009</strong> (R million)<br />
Product<br />
Accommodation<br />
<strong>for</strong><br />
visi<strong>to</strong>rs<br />
Food and<br />
beverage<br />
serving<br />
industry<br />
Passenger<br />
transport<br />
industry<br />
<strong>Tourism</strong>-characteristic industries<br />
Travel agencies<br />
Transport and other<br />
equipment reservation<br />
rental services industry<br />
Cultural and<br />
sport and<br />
recreational<br />
industry<br />
Total <strong>to</strong>urismcharacteristic<br />
industries<br />
<strong>Tourism</strong>connected<br />
industry<br />
Trade of<br />
<strong>to</strong>urismconnected<br />
goods<br />
Other<br />
industries<br />
Total output of<br />
domestic<br />
producers at<br />
basic prices<br />
Taxes less<br />
subsidies<br />
A. Specific products 29 992 4 706 57 701 2 687 4 911 6 278 101 276 5 570 14 808 121 654<br />
A.1 Characteristic products 29 992 4 706 57 701 2 687 4 911 6 278 101 276 4 268 105 544<br />
1. Accommodation services 26 280 26 280 26 280<br />
1.1 Hotel and other accommodation <strong>for</strong><br />
visi<strong>to</strong>rs other than 1.2 26 280 26 280 26 280<br />
1.2 Accommodation services associated<br />
with all types of vacation home<br />
ownership<br />
2. Restaurants and similar services 3 712 4 706 8 418 3 110 11 528<br />
3. Passenger transport services 57 701 2 687 55 389 1 158 56 547<br />
3.1 Railway passenger transport services 290 290 290<br />
3.2 Road passenger transport services 34 192 34 192 1 158 35 350<br />
3.3 Water passenger transport services 7 7 7<br />
3.4 Air passenger transport services 18 212 18 212 18 212<br />
3.5 Passenger transport equipment rental 2 687 2 687 2 687<br />
4. Travel agencies and other<br />
reservation services 4 911 4 911 4 911<br />
5. Cultural industry 226 226 226<br />
6. Sports and recreational industry 6 052 6 052 6 052<br />
A.2 Connected products 5 570 10 540 16 110<br />
Retail sales of food, beverages and<br />
<strong>to</strong>bacco 2 735 6 423 9 158<br />
Retail sales of textiles, clothing, footwear<br />
and leather products 1 001 3 002 4 002<br />
Retail sales of pharmaceutical and medical<br />
goods, cosmetic and <strong>to</strong>iletry articles 100 48 148<br />
Retail sales of household furniture,<br />
appliances, articles and equipment 649 315 965<br />
Retail sales of au<strong>to</strong>motive fuel 1 085 752 1 837<br />
B. Non-specific products 1 1 16 1 1 19 19 27 314 27 352<br />
Services 1 1 2 1 1 5 19 8 693 8 717<br />
Goods 14 14 18 621 18 635<br />
Total output (at basic prices) 29 993 4 707 57 718 2 687 4 912 6 278 101 295 5 588 42 122 149 006 4 920<br />
Total intermediate consumption (at<br />
purchasers' price) 15 487 3 074 30 288 1 580 2 979 4 903 58 426 2 797 23 871 85 094<br />
Total gross value added (at basic prices) 14 507 1 633 22 315 1 107 1 933 1 3 75 42 869 2 791 18 251 63 911<br />
**Individual figures may not add up <strong>to</strong> stated <strong>to</strong>tals due <strong>to</strong> rounding<br />
<strong>Tourism</strong> <strong>Satellite</strong> <strong>Account</strong> <strong>for</strong> <strong>South</strong> <strong>Africa</strong>, final <strong>2006</strong> and 2007and provisional 2008 <strong>to</strong> <strong>2009</strong>