Tourism Satellite Account for South Africa 2006 to 2009
Tourism Satellite Account for South Africa 2006 to 2009
Tourism Satellite Account for South Africa 2006 to 2009
You also want an ePaper? Increase the reach of your titles
YUMPU automatically turns print PDFs into web optimized ePapers that Google loves.
Statistics <strong>South</strong> <strong>Africa</strong><br />
74<br />
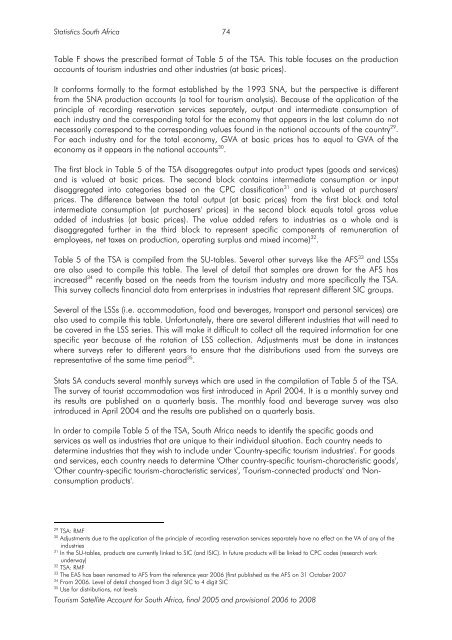
Table F shows the prescribed <strong>for</strong>mat of Table 5 of the TSA. This table focuses on the production<br />
accounts of <strong>to</strong>urism industries and other industries (at basic prices).<br />
It con<strong>for</strong>ms <strong>for</strong>mally <strong>to</strong> the <strong>for</strong>mat established by the 1993 SNA, but the perspective is different<br />
from the SNA production accounts (a <strong>to</strong>ol <strong>for</strong> <strong>to</strong>urism analysis). Because of the application of the<br />
principle of recording reservation services separately, output and intermediate consumption of<br />
each industry and the corresponding <strong>to</strong>tal <strong>for</strong> the economy that appears in the last column do not<br />
necessarily correspond <strong>to</strong> the corresponding values found in the national accounts of the country 29 .<br />
For each industry and <strong>for</strong> the <strong>to</strong>tal economy, GVA at basic prices has <strong>to</strong> equal <strong>to</strong> GVA of the<br />
economy as it appears in the national accounts 30 .<br />
The first block in Table 5 of the TSA disaggregates output in<strong>to</strong> product types (goods and services)<br />
and is valued at basic prices. The second block contains intermediate consumption or input<br />
disaggregated in<strong>to</strong> categories based on the CPC classification 31 and is valued at purchasers'<br />
prices. The difference between the <strong>to</strong>tal output (at basic prices) from the first block and <strong>to</strong>tal<br />
intermediate consumption (at purchasers' prices) in the second block equals <strong>to</strong>tal gross value<br />
added of industries (at basic prices). The value added refers <strong>to</strong> industries as a whole and is<br />
disaggregated further in the third block <strong>to</strong> represent specific components of remuneration of<br />
employees, net taxes on production, operating surplus and mixed income) 32 .<br />
Table 5 of the TSA is compiled from the SU-tables. Several other surveys like the AFS 33 and LSSs<br />
are also used <strong>to</strong> compile this table. The level of detail that samples are drawn <strong>for</strong> the AFS has<br />
increased 34 recently based on the needs from the <strong>to</strong>urism industry and more specifically the TSA.<br />
This survey collects financial data from enterprises in industries that represent different SIC groups.<br />
Several of the LSSs (i.e. accommodation, food and beverages, transport and personal services) are<br />
also used <strong>to</strong> compile this table. Un<strong>for</strong>tunately, there are several different industries that will need <strong>to</strong><br />
be covered in the LSS series. This will make it difficult <strong>to</strong> collect all the required in<strong>for</strong>mation <strong>for</strong> one<br />
specific year because of the rotation of LSS collection. Adjustments must be done in instances<br />
where surveys refer <strong>to</strong> different years <strong>to</strong> ensure that the distributions used from the surveys are<br />
representative of the same time period 35 .<br />
Stats SA conducts several monthly surveys which are used in the compilation of Table 5 of the TSA.<br />
The survey of <strong>to</strong>urist accommodation was first introduced in April 2004. It is a monthly survey and<br />
its results are published on a quarterly basis. The monthly food and beverage survey was also<br />
introduced in April 2004 and the results are published on a quarterly basis.<br />
In order <strong>to</strong> compile Table 5 of the TSA, <strong>South</strong> <strong>Africa</strong> needs <strong>to</strong> identify the specific goods and<br />
services as well as industries that are unique <strong>to</strong> their individual situation. Each country needs <strong>to</strong><br />
determine industries that they wish <strong>to</strong> include under 'Country-specific <strong>to</strong>urism industries'. For goods<br />
and services, each country needs <strong>to</strong> determine 'Other country-specific <strong>to</strong>urism-characteristic goods',<br />
'Other country-specific <strong>to</strong>urism-characteristic services', '<strong>Tourism</strong>-connected products' and 'Nonconsumption<br />
products'.<br />
29<br />
TSA: RMF<br />
30<br />
Adjustments due <strong>to</strong> the application of the principle of recording reservation services separately have no effect on the VA of any of the<br />
industries<br />
31<br />
In the SU-tables, products are currently linked <strong>to</strong> SIC (and ISIC). In future products will be linked <strong>to</strong> CPC codes (research work<br />
underway)<br />
32<br />
TSA: RMF<br />
33<br />
The EAS has been renamed <strong>to</strong> AFS from the reference year <strong>2006</strong> (first published as the AFS on 31 Oc<strong>to</strong>ber 2007<br />
34<br />
From <strong>2006</strong>. Level of detail changed from 3 digit SIC <strong>to</strong> 4 digit SIC<br />
35<br />
Use <strong>for</strong> distributions, not levels<br />
<strong>Tourism</strong> <strong>Satellite</strong> <strong>Account</strong> <strong>for</strong> <strong>South</strong> <strong>Africa</strong>, final 2005 and provisional <strong>2006</strong> <strong>to</strong> 2008


