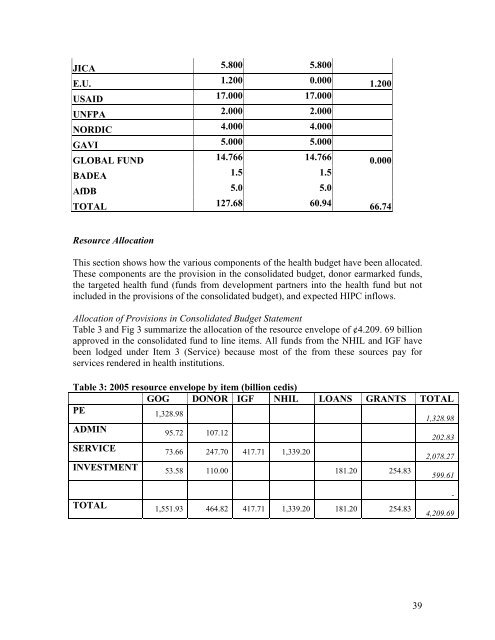
JICA 5.800 5.800 E.U. 1.200 0.000 1.200 USAID 17.000 17.000 UNFPA 2.000 2.000 NORDIC 4.000 4.000 GAVI 5.000 5.000 GLOBAL FUND 14.766 14.766 0.000 BADEA 1.5 1.5 AfDB 5.0 5.0 TOTAL 127.68 60.94 66.74 Resource Allocation This section shows how the various components <strong>of</strong> the health budget have been allocated. These components are the provision in the consolidated budget, donor earmarked funds, the targeted health fund (funds from development partners into the health fund but not included in the provisions <strong>of</strong> the consolidated budget), and expected HIPC inflows. Allocation <strong>of</strong> Provisions in Consolidated Budget Statement Table 3 and Fig 3 summarize the allocation <strong>of</strong> the resource envelope <strong>of</strong> ¢4.209. 69 billion approved in the consolidated fund to line items. All funds from the NHIL and IGF have been lodged under Item 3 (Service) because most <strong>of</strong> the from these sources pay for services rendered in health institutions. Table 3: <strong>2005</strong> resource envelope by item (billion cedis) GOG DONOR IGF NHIL LOANS GRANTS TOTAL PE 1,328.98 1,328.98 ADMIN 95.72 107.12 202.83 SERVICE 73.66 247.70 417.71 1,339.20 2,078.27 INVESTMENT 53.58 110.00 181.20 254.83 599.61 TOTAL 1,551.93 464.82 417.71 1,339.20 181.20 254.83 - 4,209.69 39
Internally Generated Funds and National <strong>Health</strong> Insurance Levy Internally Generated Funds (IGF) are funds generated from user fees. Internally generated Funds are collected and retained by BMCs and are designed to recover the complete cost <strong>of</strong> drugs and partial cost <strong>of</strong> non drugs consumables used in the provision <strong>of</strong> health care. A small consultation is also charged by health institutions. The National <strong>Health</strong> Insurance Scheme is designed to replace user fees. Both IGF and NHIL will contribute to the resource envelope and specifically to service budget (Item 3). However, they are not allocated centrally because BMCs will collect and retain such finds locally for services rendered. Allocation <strong>of</strong> Other Components <strong>of</strong> the <strong>Health</strong> Budget The rest <strong>of</strong> budget in the consolidated budget i.e. ¢2,452.78 billion has been allocated to all BMCs using the resource shift targets proposed in the five year programme <strong>of</strong> work. Table below shows the allocation to BMC categories. Table 7: Percentage distribution <strong>of</strong> non-wage Recurrent budget (Items 2 and 3) TOTAL PERSONAL EMOLUMENT ITEM 2-4 TOT 2&3 ADMIN ADMIN ADMIN TOT SERVI CE SERVICE TOT INVEST INVEST TOT GOG DONOR SERVICE GOG DONOR INVEST GOG DONOR % non-wage recurrent TOTAL HEALTH 2,452,781 1,328,975 1,123,806 524,194 202,834 95,716 107,118 321,360 73,659 247,701 599,612 53,577 546,035 100 <strong>Ministry</strong> <strong>of</strong> <strong>Health</strong> hq 1,311,860 765,248 546,613 64,774 23,330 10,462 12,868 41,444 11,411 30,033 481,839 21,000 460,839 12.4 Training Institutions total 86,620 55,527 31,093 31,093 11,236 5,013 6,223 19,857 5,467 14,390 - - - 5.9 G.H.S. HQ 96,056 8,974 87,082 53,082 19,182 8,558 10,624 33,900 9,334 24,567 34,000 9,000 25,000 10.1 Psychiatric Hospitals 46,155 13,893 32,262 31,562 11,405 5,088 6,317 20,157 5,550 14,607 700 700 - 6.0 Regl H. Service 128,998 66,742 62,255 51,440 18,950 8,454 10,495 32,491 8,221 24,270 10,815 10,815 - 9.8 District Hlth Serv 538,625 321,018 217,607 212,607 89,878 45,321 44,557 122,729 19,695 103,034 5,000 2,000 3,000 40.6 Subvented organizations 62,242 13,476 48,766 27,855 10,143 4,471 5,671 17,713 4,877 12,836 20,911 715 20,196 5.3 Teaching Hospitals 182,225 84,097 98,128 51,781 18,712 8,348 10,363 33,070 9,105 23,965 46,347 9,347 37,000 9.9 Ring-Fencing The <strong>Ministry</strong> ring has fenced ¢879.98 <strong>of</strong> the component <strong>of</strong> the budget and lodged it in specific BMCs. These funds were ring-fenced to protect critical areas <strong>of</strong> the programme <strong>of</strong> work from the risk <strong>of</strong> under funding which might arise after funds have been disbursed to BMCs. Ring fencing is also used as an instrument for improving resource allocation within the sector by ensuring that the resource allocation pattern emphasises poverty alleviation and equity. Table 4 shows activities for which funds have been ring-fenced and where such funds have been lodged. Table five the relationship between the ring fenced budget and the total budget. Ring fenced budget Table 4: Allocation <strong>of</strong> Ring- fenced areas <strong>2005</strong> Resource Allocation (in billions <strong>of</strong> cedi) Item 1 Amount (billion Where lodged cedi) Recruitment into the sector 26.53 Office <strong>of</strong> Minister 40