
You also want an ePaper? Increase the reach of your titles
YUMPU automatically turns print PDFs into web optimized ePapers that Google loves.
<strong>ECSA</strong><br />
<strong>The</strong> <strong>Tramp</strong> <strong>Shipping</strong> <strong><strong>Mar</strong>ket</strong><br />
3.4.3 Liner <strong>Shipping</strong><br />
<strong>The</strong> liner provides scheduled services at a fixed frequency over a pre-determined route,<br />
making sea transport available to cargo lots of all sizes. Liner companies have extensive<br />
organisations, often in many countries, and the cost of ship operation is a relatively small part<br />
of total expenses. <strong>The</strong> governing freight document is the Bill of Lading or seaway bill, with<br />
the number of Bs/L issued per ship and even per container varying very substantially,<br />
depending on parcel size.<br />
Containerisation and the dissemination of the just in time approach have subordinated liner<br />
shipping within a door to door context of which the sea leg is only part, and not necessarily<br />
the most expensive part. Liner shipping caters for cargo of all kinds and, despite the high cost<br />
of ships and containers, participation in bulk cargoes is not inconsiderable and rising. Waste<br />
paper, is for example, perhaps the biggest single cargo carried in containerships, because of<br />
the need to return empty containers to loading areas generating better revenues. A healthy<br />
general cargo sector coexists within the liner sector, but, apart from specialist liner services<br />
(heavy lift, forest products, cars, refrigerated cargoes), non-cellular general cargo ships tend<br />
to operate over routes with small cargo constituencies or in countries with poor port<br />
infrastructures, increasingly in short sea trades. In addition cargo liners are involved in<br />
through transport of containers.<br />
4. Differentiation of sea transport demand<br />
4.1 Price and service aspects of sea transport demand<br />
<strong>The</strong>re are four aspects to the service offered by the shipping services discussed in the previous<br />
paragraphs which allow a degree of service differentiation:<br />
1. Price: <strong>The</strong> freight cost is always important, but the greater the proportion of freight in the<br />
overall cost equation, the more emphasis shippers are likely to place on it. For many<br />
primary commodities shown on the left of Figure 1 price is the major consideration, but<br />
for semi manufactures and manufactures the service elements discussed in 2-4 below are<br />
also very significant.<br />
2. Speed: Time in transit incurs an inventory cost, so shippers of high-value commodities<br />
value speed. <strong>The</strong> cost of holding high-value commodities in stock may make it cheaper to<br />
ship small quantities frequently even if the freight cost is greater. On a three-month<br />
journey a cargo worth $100,000 incurs an inventory cost of $2,500 if interest rates are 10<br />
per cent per annum, though in today’s low interest environment inventory cost depends<br />
more on the less easily quantified value to the business of fast, prompt and predictable<br />
delivery of the goods in transit. For example fast delivery may be important for<br />
commercial reasons. Reliability: With the growing importance of `just in time' stock<br />
control systems, transport reliability has taken on a new significance. Some shippers may<br />
be prepared to pay more for a service which is guaranteed to operate to time and provide<br />
cargo capacity at all times.<br />
3. Security: Loss or damage in<br />
transit is an insurable risk, but<br />
raises many difficulties for the<br />
shipper, who may well be<br />
prepared to pay more for secure<br />
transportation of his product<br />
without risk of damage.<br />
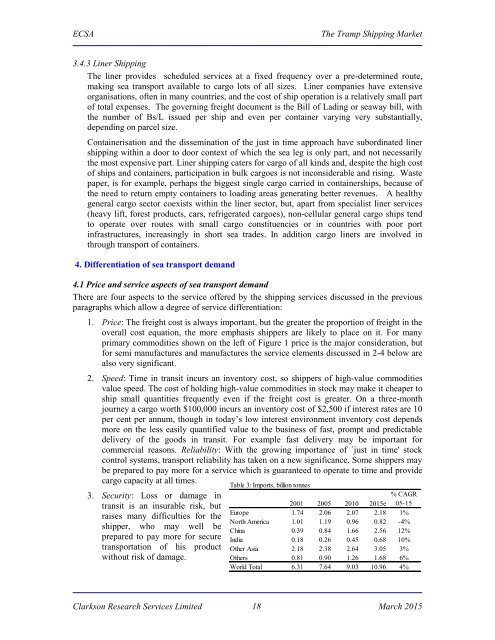
Table 3: Imports, billion tonnes<br />
2001 2005 2010 <strong>2015</strong>e<br />
% CAGR<br />
05-15<br />
Europe 1.74 2.06 2.07 2.18 1%<br />
North America 1.01 1.19 0.96 0.82 -4%<br />
China 0.39 0.84 1.66 2.56 12%<br />
India 0.18 0.26 0.45 0.68 10%<br />
Other Asia 2.18 2.38 2.64 3.05 3%<br />
Others 0.81 0.90 1.26 1.68 6%<br />
World Total 6.31 7.64 9.03 10.96 4%<br />
Clarkson Research Services Limited 18 <strong>Mar</strong>ch <strong>2015</strong>