
Create successful ePaper yourself
Turn your PDF publications into a flip-book with our unique Google optimized e-Paper software.
<strong>ECSA</strong><br />
<strong>The</strong> <strong>Tramp</strong> <strong>Shipping</strong> <strong><strong>Mar</strong>ket</strong><br />
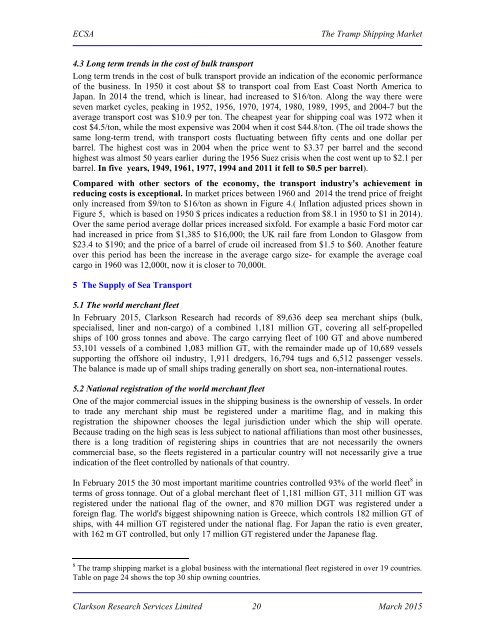
4.3 Long term trends in the cost of bulk transport<br />
Long term trends in the cost of bulk transport provide an indication of the economic performance<br />
of the business. In 1950 it cost about $8 to transport coal from East Coast North America to<br />
Japan. In 2014 the trend, which is linear, had increased to $16/ton. Along the way there were<br />
seven market cycles, peaking in 1952, 1956, 1970, 1974, 1980, 1989, 1995, and 2004-7 but the<br />
average transport cost was $10.9 per ton. <strong>The</strong> cheapest year for shipping coal was 1972 when it<br />
cost $4.5/ton, while the most expensive was 2004 when it cost $44.8/ton. (<strong>The</strong> oil trade shows the<br />
same long-term trend, with transport costs fluctuating between fifty cents and one dollar per<br />
barrel. <strong>The</strong> highest cost was in 2004 when the price went to $3.37 per barrel and the second<br />
highest was almost 50 years earlier during the 1956 Suez crisis when the cost went up to $2.1 per<br />
barrel. In five years, 1949, 1961, 1977, 1994 and 2011 it fell to $0.5 per barrel).<br />
Compared with other sectors of the economy, the transport industry's achievement in<br />
reducing costs is exceptional. In market prices between 1960 and 2014 the trend price of freight<br />
only increased from $9/ton to $16/ton as shown in Figure 4.( Inflation adjusted prices shown in<br />
Figure 5, which is based on 1950 $ prices indicates a reduction from $8.1 in 1950 to $1 in 2014).<br />
Over the same period average dollar prices increased sixfold. For example a basic Ford motor car<br />
had increased in price from $1,385 to $16,000; the UK rail fare from London to Glasgow from<br />
$23.4 to $190; and the price of a barrel of crude oil increased from $1.5 to $60. Another feature<br />
over this period has been the increase in the average cargo size- for example the average coal<br />
cargo in 1960 was 12,000t, now it is closer to 70,000t.<br />
5 <strong>The</strong> Supply of Sea Transport<br />
5.1 <strong>The</strong> world merchant fleet<br />
In February <strong>2015</strong>, Clarkson Research had records of 89,636 deep sea merchant ships (bulk,<br />
specialised, liner and non-cargo) of a combined 1,181 million GT, covering all self-propelled<br />
ships of 100 gross tonnes and above. <strong>The</strong> cargo carrying fleet of 100 GT and above numbered<br />
53,101 vessels of a combined 1,083 million GT, with the remainder made up of 10,689 vessels<br />
supporting the offshore oil industry, 1,911 dredgers, 16,794 tugs and 6,512 passenger vessels.<br />
<strong>The</strong> balance is made up of small ships trading generally on short sea, non-international routes.<br />
5.2 National registration of the world merchant fleet<br />
One of the major commercial issues in the shipping business is the ownership of vessels. In order<br />
to trade any merchant ship must be registered under a maritime flag, and in making this<br />
registration the shipowner chooses the legal jurisdiction under which the ship will operate.<br />
Because trading on the high seas is less subject to national affiliations than most other businesses,<br />
there is a long tradition of registering ships in countries that are not necessarily the owners<br />
commercial base, so the fleets registered in a particular country will not necessarily give a true<br />
indication of the fleet controlled by nationals of that country.<br />
In February <strong>2015</strong> the 30 most important maritime countries controlled 93% of the world fleet 8 in<br />
terms of gross tonnage. Out of a global merchant fleet of 1,181 million GT, 311 million GT was<br />
registered under the national flag of the owner, and 870 million DGT was registered under a<br />
foreign flag. <strong>The</strong> world's biggest shipowning nation is Greece, which controls 182 million GT of<br />
ships, with 44 million GT registered under the national flag. For Japan the ratio is even greater,<br />
with 162 m GT controlled, but only 17 million GT registered under the Japanese flag.<br />
8 <strong>The</strong> tramp shipping market is a global business with the international fleet registered in over 19 countries.<br />
Table on page 24 shows the top 30 ship owning countries.<br />
Clarkson Research Services Limited 20 <strong>Mar</strong>ch <strong>2015</strong>