
Create successful ePaper yourself
Turn your PDF publications into a flip-book with our unique Google optimized e-Paper software.
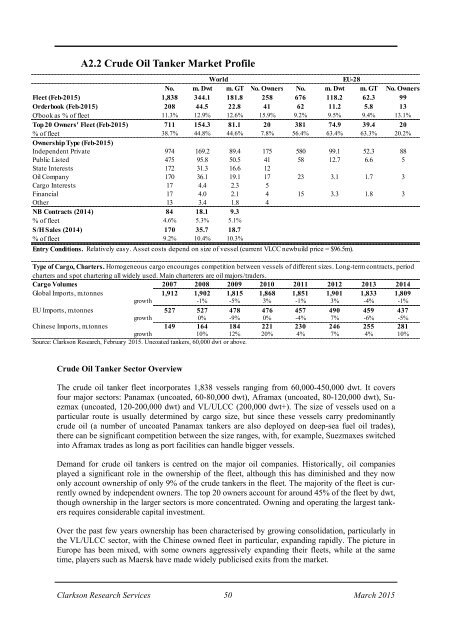
A2.2 Crude Oil Tanker <strong><strong>Mar</strong>ket</strong> Profile<br />
World<br />
EU-28<br />
No. m. Dwt m. GT No. Owners No. m. Dwt m. GT No. Owners<br />
Fleet (Feb-<strong>2015</strong>) 1,838 344.1 181.8 258 676 118.2 62.3 99<br />
Orderbook (Feb-<strong>2015</strong>) 208 44.5 22.8 41 62 11.2 5.8 13<br />
O'book as % of fleet 11.3% 12.9% 12.6% 15.9% 9.2% 9.5% 9.4% 13.1%<br />
Top 20 Owners' Fleet (Feb-<strong>2015</strong>) 711 154.3 81.1 20 381 74.9 39.4 20<br />
% of fleet 38.7% 44.8% 44.6% 7.8% 56.4% 63.4% 63.3% 20.2%<br />
Ownership Type (Feb-<strong>2015</strong>)<br />
Independent Private 974 169.2 89.4 175 580 99.1 52.3 88<br />
Public Listed 475 95.8 50.5 41 58 12.7 6.6 5<br />
State Interests 172 31.3 16.6 12<br />
Oil Company 170 36.1 19.1 17 23 3.1 1.7 3<br />
Cargo Interests 17 4.4 2.3 5<br />
Financial 17 4.0 2.1 4 15 3.3 1.8 3<br />
Other 13 3.4 1.8 4<br />
NB Contracts (2014) 84 18.1 9.3<br />
% of fleet 4.6% 5.3% 5.1%<br />
S/H Sales (2014) 170 35.7 18.7<br />
% of fleet 9.2% 10.4% 10.3%<br />
Entry Conditions. Relatively easy. Asset costs depend on size of vessel (current VLCC newbuild price = $96.5m).<br />
Type of Cargo, Charters. Homogeneous cargo encourages competition between vessels of different sizes. Long-term contracts, period<br />
charters and spot chartering all widely used. Main charterers are oil majors/traders.<br />
Cargo Volumes 2007 2008 2009 2010 2011 2012 2013 2014<br />
Global Imports, m.tonnes 1,912 1,902 1,815 1,868 1,851 1,901 1,833 1,809<br />
growth -1% -5% 3% -1% 3% -4% -1%<br />
EU Imports, m.tonnes 527 527 478 476 457 490 459 437<br />
growth 0% -9% 0% -4% 7% -6% -5%<br />
Chinese Imports, m.tonnes 149 164 184 221 230 246 255 281<br />
growth 10% 12% 20% 4% 7% 4% 10%<br />
Source: Clarkson Research, February <strong>2015</strong>. Uncoated tankers, 60,000 dwt or above.<br />
Crude Oil Tanker Sector Overview<br />
<strong>The</strong> crude oil tanker fleet incorporates 1,838 vessels ranging from 60,000-450,000 dwt. It covers<br />
four major sectors: Panamax (uncoated, 60-80,000 dwt), Aframax (uncoated, 80-120,000 dwt), Suezmax<br />
(uncoated, 120-200,000 dwt) and VL/ULCC (200,000 dwt+). <strong>The</strong> size of vessels used on a<br />
particular route is usually determined by cargo size, but since these vessels carry predominantly<br />
crude oil (a number of uncoated Panamax tankers are also deployed on deep-sea fuel oil trades),<br />
there can be significant competition between the size ranges, with, for example, Suezmaxes switched<br />
into Aframax trades as long as port facilities can handle bigger vessels.<br />
Demand for crude oil tankers is centred on the major oil companies. Historically, oil companies<br />
played a significant role in the ownership of the fleet, although this has diminished and they now<br />
only account ownership of only 9% of the crude tankers in the fleet. <strong>The</strong> majority of the fleet is currently<br />
owned by independent owners. <strong>The</strong> top 20 owners account for around 45% of the fleet by dwt,<br />
though ownership in the larger sectors is more concentrated. Owning and operating the largest tankers<br />
requires considerable capital investment.<br />
Over the past few years ownership has been characterised by growing consolidation, particularly in<br />
the VL/ULCC sector, with the Chinese owned fleet in particular, expanding rapidly. <strong>The</strong> picture in<br />
Europe has been mixed, with some owners aggressively expanding their fleets, while at the same<br />
time, players such as Maersk have made widely publicised exits from the market.<br />
Clarkson Research Services 50 <strong>Mar</strong>ch <strong>2015</strong>