
Create successful ePaper yourself
Turn your PDF publications into a flip-book with our unique Google optimized e-Paper software.
<strong>ECSA</strong><br />
<strong>The</strong> <strong>Tramp</strong> <strong>Shipping</strong> <strong><strong>Mar</strong>ket</strong><br />
transport process. For example oil companies often run their own fleet of tankers, or offer long<br />
term time charters.<br />
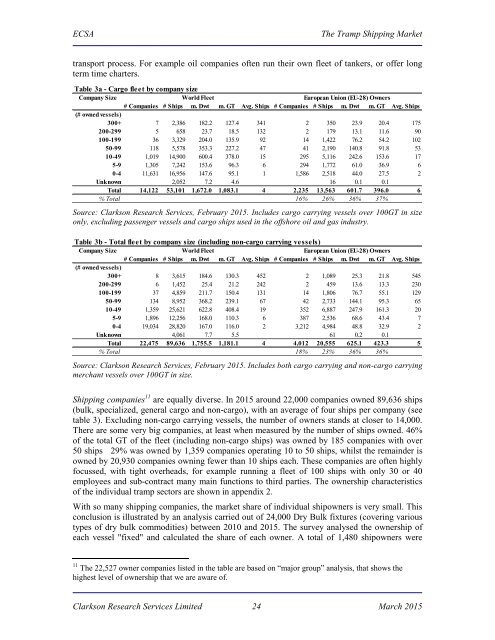
Table 3a - Cargo fleet by company size<br />
Company Size World Fleet European Union (EU-28) Owners<br />
# Companies # Ships m. Dwt m. GT Avg. Ships # Companies # Ships m. Dwt m. GT Avg. Ships<br />
(# owned vessels)<br />
300+ 7 2,386 182.2 127.4 341 2 350 23.9 20.4 175<br />
200-299 5 658 23.7 18.5 132 2 179 13.1 11.6 90<br />
100-199 36 3,329 204.0 135.9 92 14 1,422 76.2 54.2 102<br />
50-99 118 5,578 353.3 227.2 47 41 2,190 140.8 91.8 53<br />
10-49 1,019 14,900 600.4 378.0 15 295 5,116 242.6 153.6 17<br />
5-9 1,305 7,242 153.6 96.3 6 294 1,772 61.0 36.9 6<br />
0-4 11,631 16,956 147.6 95.1 1 1,586 2,518 44.0 27.5 2<br />
Unknown 2,052 7.2 4.6 16 0.1 0.1<br />
Total 14,122 53,101 1,672.0 1,083.1 4 2,235 13,563 601.7 396.0 6<br />
% Total 16% 26% 36% 37%<br />
Source: Clarkson Research Services, February <strong>2015</strong>. Includes cargo carrying vessels over 100GT in size<br />
only, excluding passenger vessels and cargo ships used in the offshore oil and gas industry.<br />
Table 3b - Total fleet by company size (including non-cargo carrying vessels)<br />
Company Size World Fleet European Union (EU-28) Owners<br />
# Companies # Ships m. Dwt m. GT Avg. Ships # Companies # Ships m. Dwt m. GT Avg. Ships<br />
(# owned vessels)<br />
300+ 8 3,615 184.6 130.3 452 2 1,089 25.3 21.8 545<br />
200-299 6 1,452 25.4 21.2 242 2 459 13.6 13.3 230<br />
100-199 37 4,859 211.7 150.4 131 14 1,806 76.7 55.1 129<br />
50-99 134 8,952 368.2 239.1 67 42 2,733 144.1 95.3 65<br />
10-49 1,359 25,621 622.8 408.4 19 352 6,887 247.9 161.3 20<br />
5-9 1,896 12,256 168.0 110.3 6 387 2,536 68.6 43.4 7<br />
0-4 19,034 28,820 167.0 116.0 2 3,212 4,984 48.8 32.9 2<br />
Unknown 4,061 7.7 5.5 61 0.2 0.1<br />
Total 22,475 89,636 1,755.5 1,181.1 4 4,012 20,555 625.1 423.3 5<br />
% Total 18% 23% 36% 36%<br />
Source: Clarkson Research Services, February <strong>2015</strong>. Includes both cargo carrying and non-cargo carrying<br />
merchant vessels over 100GT in size.<br />
<strong>Shipping</strong> companies 11 are equally diverse. In <strong>2015</strong> around 22,000 companies owned 89,636 ships<br />
(bulk, specialized, general cargo and non-cargo), with an average of four ships per company (see<br />
table 3). Excluding non-cargo carrying vessels, the number of owners stands at closer to 14,000.<br />
<strong>The</strong>re are some very big companies, at least when measured by the number of ships owned. 46%<br />
of the total GT of the fleet (including non-cargo ships) was owned by 185 companies with over<br />
50 ships 29% was owned by 1,359 companies operating 10 to 50 ships, whilst the remainder is<br />
owned by 20,930 companies owning fewer than 10 ships each. <strong>The</strong>se companies are often highly<br />
focussed, with tight overheads, for example running a fleet of 100 ships with only 30 or 40<br />
employees and sub-contract many main functions to third parties. <strong>The</strong> ownership characteristics<br />
of the individual tramp sectors are shown in appendix 2.<br />
With so many shipping companies, the market share of individual shipowners is very small. This<br />
conclusion is illustrated by an analysis carried out of 24,000 Dry Bulk fixtures (covering various<br />
types of dry bulk commodities) between 2010 and <strong>2015</strong>. <strong>The</strong> survey analysed the ownership of<br />
each vessel "fixed" and calculated the share of each owner. A total of 1,480 shipowners were<br />
11 <strong>The</strong> 22,527 owner companies listed in the table are based on “major group” analysis, that shows the<br />
highest level of ownership that we are aware of.<br />
Clarkson Research Services Limited 24 <strong>Mar</strong>ch <strong>2015</strong>